Download
1 / 61
610 likes | 734 Views
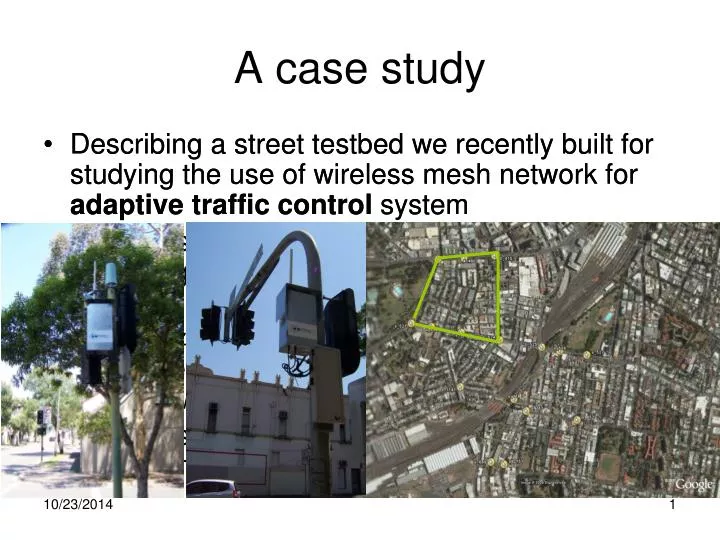
A case study. Describing a street testbed we recently built for studying the use of wireless mesh network for adaptive traffic control system Discuss some initial measurement results regarding link characteristics of 802.11 900Mhz Ethernet over powerline and Unwired (a WiMax variant)

E N D
A case study • Describing a street testbed we recently built for studying the use of wireless mesh network for adaptive traffic control system • Discuss some initial measurement results regarding link characteristics of • 802.11 • 900Mhz • Ethernet over powerline • and Unwired (a WiMax variant) • Discuss some of our experience in building a testbed in a real-life environment • Describing a street testbed we recently built for studying the use of wireless mesh network for adaptive traffic control system • Discuss some initial measurement results regarding link characteristics of • 802.11 • 900Mhz • Ethernet over powerline • and Unwired (a WiMax variant) • Discuss some of our experience in building a testbed in a real-world environment
Adaptive Traffic Control • How it works • Road-side sensors detect the states of vehicle/road • e.g loop detector under the pavement for vehicle counting • Sensor data is fed to traffic light controller • Sensor data can be also fed to variable speed limit sign • the controller uses the sensor data to make decision about the duration of green/red lights
Sensor info from other intersections Turn green at t1 for 30sec C=8 for the last 10 sec Traffic server (Regional Computer) loop detector Traffic controller C=C+1
Communication for traffic control system • Traditionally rely on wired connections • Private or leased lines • High operating cost, inflexibility • People have started looking at using public shared network • eg. ADSL, GPRS • Inconsistent delay jitter and reliability issues • e.g. GPRS can have high RTT (>1sec), fluctuating bandwidth and occasional outage
Sydney Coordinated Adaptive Traffic System (SCATS) • A popular traffic management system (used by >100 cities) • Created by Sydney RTA (Road and Transport Authority) • Serial point-to-point communication over voice-grade telephone line, using 300bps modem • Hierarchical structure • TMC (Traffic Management Center) • Regional Computers (RC) • Traffic controllers TMC RC RC RC controller controller controller
Second-by-second SCATS messages Regional Computer Controller Loop detector
SCATS protocol • Periodic message exchanges: every sec • If RC does not receive ACK within 1 sec: retry • If the ACK fails to arrive the 2nd time: link failure • Controller enters ‘self-controlling’ mode and stays in this mode for 15 min • Uncoordinated traffic control • extend by another 15 min if another communication failure happens in this mode control command controller RC Sensor data + ACK
Summary for communication layer of traffic control • Wired connections are typically used • private or leased from public telecommunications operators • Traffic signal data demand is light • Low-bandwidth dial-up network is commonly used • But reliability and latency are critical issues
What are the problems? • High cost • High front-end cost • RTA pays 14 millions each year to Telstra for the leased lines • High maintenance cost • Installation or relocation is expensive • Very inflexible • installation/relocation incur long delays • Low bandwidth • RTA uses 300 bps dial-up lines! • Difficult to integrate other sensors/equipment (e.g. video cameras)
Wireless mesh network • Getting increasing popularity recently • Trial deployment in several major cities • Strix, Tropos, LocustWorld, etc • A competitive ‘last-mile’ solution • Application: residential broadband, public safety • Our research • Using mesh network for a mission-critical system such as traffic control • Can we use low-cost, standard-based wireless technology (such as 802.11, 802.16) to build a dedicated RTA wireless network? • Different requirement from prior work • Trade throughput for latency and reliability
Research Challenges • Scalability • Connecting numerous road-side devices to SCATS • Reliability • Mission-critical data (e.g. accident detection, traffic signal control, etc) • Requires timely routing that is robust against faults in nodes or links • Low latency • SCATS is a real-time traffic control system (< 1 sec)
Today’s talk: The testbed • Collaborate with New South Wales Road and Traffic Authority (NSW RTA) • Study the feasibility of using wireless mesh network for traffic control
Outline • Background • Site survey for the testbed • What is typical node distance? • Traffic controller map • Feasibility of using off-the-shelf hardware? • Intersection-pair measurements • Wireless mesh testbed • Preliminary results • Experience we learned and conclusion
Typical distance between two adjacent traffic lights? • Q: What is the degree of connectivity between traffic controller for a given radio range? • Data source: traffic controller map for Sydney CBD area (2787 traffic controllers) • 354 traffic controllers have their closest neighbors within 100m • 2407 traffic controllers have their closest neighbors within 500m • 2701 traffic controllers have their closest neighbors within 1000m
Degree of connectivity between traffic controllers to ensure that 90% (2500) nodes each has at least 3 neighbours (e.g. for fault tolerance) requires a radio range of at least 1km.
Wireless survey • Building a testbed in real world can involve lots of $$ • ~$NTD 500K for only 7 nodes • Not to mention the numerous man-hours • To understand the feasibility of using off-the-shelf 802.11 radios products • What is the performance of 802.11 with different parameter settings?
Experiment setup • 20 intersection pairs • Two linux laptop • External antennas • 8 dBi omni-directional • 14 dBi directional • Two wireless interfaces: Intel Centrino (RFMON) and Senao SL-2511CD (200mW) • Antenna height: 4m • signal loss over the coaxial cable: 2.7dB • Duration of each experiment: 5 min (3 times for consistency) • Use GPS to measure distance between intersections
Factors that might affect the performance of 802.11 • Effect of • Distance • Transmission rate • Number of MAC-layer retry • Type of antenna
Effect of the distance • Pathloss: attenuationexperienced by a wireless signal as a function of distance • Shadowing: amount of variations in pathloos between similarpropagation scenarios • prior worksuggested pathloss can rangefrom 2 to 5 for outdoor urban environment • Using linear regression, we find our environment has a pathloos 3.1 and shadowing 7.2 • significantly lower than the suggested urban pathloss of 4 in the literature
Effect of transmission rate • Higher transmission rates • allow high qualitylinks to transmit more data • but have a higher lossprobability on lossy links. • throughput is a function of transmission rate and the deliveryprobability. • We tried 1Mbps, 2Mbps, 5.5Mbps,11Mbps • Most of our links have a higher throughput when using ahigher transmission rate
Effect of maximum retries • MAX-RETRY is one of the wireless card parameters • A higher retry limit • Decrease the probability that a packet is dropped due to a link error • potentially increase the probability ofnetwork interface buffer overflow and thelatency • A optimal setting depends on the channel conditions and flow rate • MAX-RETRY=10 seems to work best in our case • MAC-layer re-transmissions is a norm • our links have intermediate quality
More than 50% are retransmitted at the MAC layer Link distance: 200m MAX-RETRY=10
Omni-directional vs. directional • Directional antenna + increased spatial reuse and improved signal quality + less power consumption while maintaining a similar link quality • higher cost • Deployment • Opportunistic forwarding
9 pair > 5Mbps 13 pairs: no loss Intersection selection (omni-directional, 11Mbps)
14 pair > 5Mbps 19 pairs: no loss Intersection selection (directional, 11Mbps)
Outline • Background • Site survey for the testbed • Wireless mesh testbed • Hardware and software • Preliminary results • Experience we learned and conclusion
Street testbed CBD 200m 200m 400m 500m 200m 200m 300m Univ. of Sydney NICTA
STaRCOMM testbed • Cover 7 intersections in Sydney CBD (Central Business District) • Inter-node distance 200m ~ 500m • 500m x 1000m area • Currently extending to 15-20 nodes • Nodes are custom-build embedded PCs • NLOS for all the nodes • Three types of nodes • mesh nodes • gateway node • Curbside node
Node • mesh nodes • Each node has 3 radio interfaces • Two 2.4GHz (802.11) or one 2.4GHz + one 900MHz • One 3.5GHz (WiMax variant) for backhaul • Connect to traffic controller via powerline communication • gateway node • located at Sydney U. • Connect to mesh nodes via 802.11 • Connect to Regional Computer (at NICTA) via AARNet • Curbside node • Located in traffic controller housing • One serial interface (to traffic controller) and one IP interface (to mesh node via ethernet-over-powerline) • Encapsulate SCATS data into IP packet and decapsulate IP packet into serial data
Traffic controller 413 414 415 c6 Motherboard Ethernet switch Unwired modem 521 522 523 524 m0 Unwired Net Usyd Net (Internet) NICTA Power line Mesh node Wired RC Testbed management 3.5GHz Gateway node 2.4GHz curbside node 900MHz
VIA MB770F motherboard Ubiquity SR2 (400mW) w/ 8dBi omni-directional ant. Ubiquity SR9 (700mW) w/ 6dBi omni-directional ant. Uniwred modem Diamond digital router Netgear powerLAN adapter Fault recovery Remote switch Watchdog timer Roof for water/heat proof Mosquito mesh for insect proof Mesh node
Curbside Node Power-over-ethernet adapter
Software • custom-built Linux OS image • watchdog timer • A daemon periodically update the timer to keep system from rebooting • Software from Orbit project • Including OML for measurement collection
Outline • Background • Site survey for the testbed • Wireless mesh testbed • Preliminary results • Experience we learned and conclusion
Effect of hop numbers on losses (2.4GHz) One hop: 521-522 Two hop: 521-523 • Consecutive loss increases as the number of hops increase • On the same link or from different links?
Effect of distance on losses (with 2.4GHz) 521-522: 200m 521-523: 400m losses become burstier as the distance increases
Effect of number of hops on latency Latency and its variation increase as the number of hops increase
Effect of distance on latency Latency is not strongly correlated with distance
Effect of distance on loss Loss is not completely correlated with distance: location-dependant
Effect of antenna location Antenna location makes a difference
900MHz vs. 2.4GHz 900MHz has a lower loss rate but higher latency: due to retry?
Power-line communication Powerline communication works pretty well when distance is within Its operation region
Throughput from different technologies • Larger variation for 900 Hz • powerline does better than radio when the distance is short
413 414 415 521 522 523 524 Unwired NICTA Latency of Unwired link(round-trip delay from mesh node to unwired gateway) A • High latency • Large variation • Outage is common A B
Latency of backhaul link(round-trip delay from nicta to mesh node) A A+B A+B Almost half of the delay happens on the Unwired wireless link
Clear Diurnal Pattern • More interference? • Other user traffic causing network congestion?
Outline • Background • Site survey for the testbed • Wireless mesh testbed • Preliminary results • Experience we learned and conclusion
Deployment • Protection of antenna connectors is necessary • Connectors often held on by weak glue or crimp. • Gradual stress (e.g.vibration) couldeventually loosen the plug • degrade the signalbefore it is transmitted into the air • Make sure that your wireless cards comply to the specification before starting using them. • E.g. some of our Senao wireless cards does not output 200mW as they should