Download
1 / 23
240 likes | 414 Views
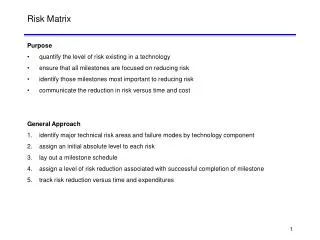
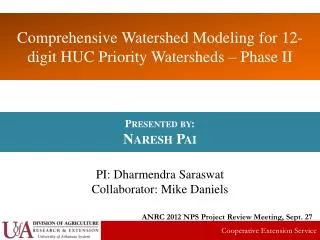
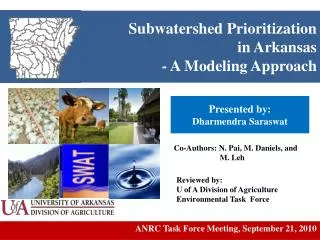
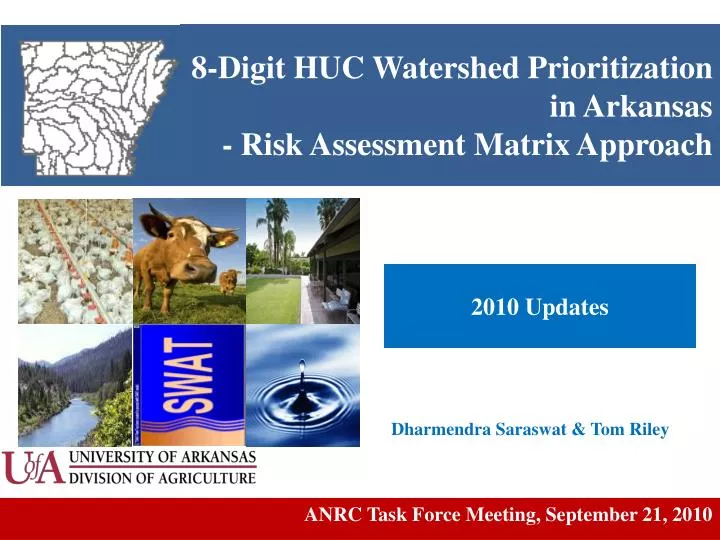
8-Digit HUC Watershed Prioritization in Arkansas - Risk Assessment Matrix Approach. 2010 Updates. Dharmendra Saraswat & Tom Riley. ANRC Task Force Meeting, September 21, 2010. Arkansas Approach. Arkansas embarked on developing a proactive stakeholder process

E N D
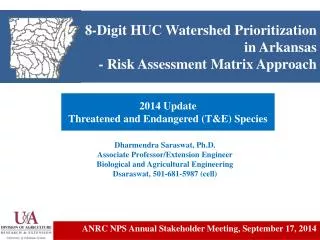
8-Digit HUC Watershed Prioritizationin Arkansas- Risk Assessment Matrix Approach 2010 Updates • DharmendraSaraswat & Tom Riley ANRC Task Force Meeting, September 21, 2010
Arkansas Approach Arkansas embarked on developing a proactive stakeholder process A comparative risk assessment based collaborative process that integrate scientific analysis and stakeholder deliberation ANRC Task Force Meeting, September 21, 2010
Goal • Select a few watersheds for priority implementation • Priority watersheds eligible for 319(h) incremental funding • Target known water quality impairments • Effectively allocate resources ANRC Task Force Meeting, September 21, 2010
Process 2005-2009 Plan 2008 Revision ANRC Task Force Meeting, September 21, 2010
1. Water Body Impairment 2008 2009 ANRC Task Force Meeting, September 21, 2010
2. Designated Use Impact - implementation *Ignore those with source “MP” ANRC Task Force Meeting, September 21, 2010
3. Biotic Impact - implementation ANRC Task Force Meeting, September 21, 2010
4. Potential Human Exposure ANRC Task Force Meeting, September 21, 2010
5. Urban/Suburban Population • Percentile rank of population density of urban and suburban area • Score = Percentile rank x 10 ANRC Task Force Meeting, September 21, 2010
6. Impervious Surface • 2006 Land Use/Land Cover • Estimate percentage of pervious surface • Calculate percentile rank • Score = percentile rank x 10 ANRC Task Force Meeting, September 21, 2010
7. Economic Activity Change to 1 ANRC Task Force Meeting, September 21, 2010
8. Cropland - implementation • Acreage of harvested area for each county from 2007 USDA agriculture census* • Watershed acreage based on area weighting • Calculate percentile of watershed harvested cropland density • Score = percentile x10 *http://www.agcensus.usda.gov/ ANRC Task Force Meeting, September 21, 2010
9. Livestock & Pasture • Percentile rank of density of animal units x 5 • Percentile rank of density of pasture x 5 • Score = Livestock + Pasture ANRC Task Force Meeting, September 21, 2010
10. Unpaved Roads - implementation • Calculate length of un-paved roads for each watershed using the AHTD Roads GIS layer* • Calculate percentile rank of density of unpaved roads for each watershed • Score = Percentile rank x 10 * Arkansas State Highway and Transportation Department/GeoStor ANRC Task Force Meeting, September 21, 2010
11. Forestry 2009 recommendation • Density of public, state, and private forest land in each watershed in 2006* • Calculate percentile rank for public and private forests • Score = State Forest x 2 + Public Forest x 3 + Private Forest x 5 *CAST/GeoStor ANRC Task Force Meeting, September 21, 2010
12. Priority of Neighboring State ANRC Task Force Meeting, September 21, 2010
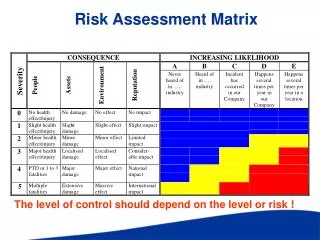
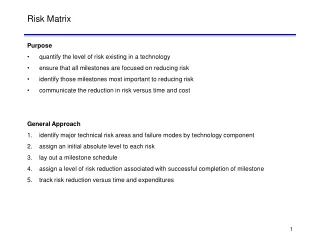
Arkansas Approach – Steps Used in 2010 Matrix Assign Score for Each Category Final Score = Overlay 4 4 4 4 4 4 10 4 10 4 4 4 4 4 4 4 4 4 8 8 0 8 8 0 8 8 8 8 8 8 8 8 8 8 8 8 10 10 10 10 10 10 10 10 10 10 10 10 10 10 10 10 10 10 3 3 3 0 3 3 3 3 3 3 3 3 3 3 3 3 0 3 X 1. Water Impairment 6 6 6 6 6 6 6 6 6 0 6 6 6 6 0 6 6 6 8 0 8 8 0 8 8 8 8 8 8 8 8 8 8 8 8 8 0 6 6 6 6 6 6 6 0 6 6 6 6 6 6 6 6 6 2 2 2 2 2 2 2 2 2 2 2 2 2 2 2 2 10 10 1. Water Impairment ( 2. Use Impact 10 10 10 0 10 10 10 10 10 0 10 10 10 10 10 10 10 10 5 5 5 5 5 5 0 0 5 5 5 5 5 5 5 5 5 5 1 1 0 1 1 1 1 1 1 1 1 1 0 1 1 1 1 1 3 3 3 3 3 3 3 3 3 3 0 3 0 3 3 3 3 3 7 7 7 7 7 7 7 0 7 7 7 7 7 7 7 7 0 7 9 9 9 9 9 9 0 9 9 9 9 9 9 0 9 9 9 9 10 10 10 10 10 10 10 10 10 10 10 10 10 10 10 10 10 10 3 3 3 3 3 3 3 3 3 3 3 0 3 0 3 3 3 3 3. Biotic Impact 4. Human Exposure 5. Urban/Suburban Population 2. Use Impact 6. Impervious Surface 7. Economic Activity 8. Cropland 9. Livestock & Pasture 10. Unpaved Roads 12. Neighboring State Priority 11. Forestry ) 12. Neighbor’s Priority ANRC Task Force Meeting, September 21, 2010
Priority Map ANRC Task Force Meeting, September 21, 2010
Priority Watersheds ANRC Task Force Meeting, September 21, 2010
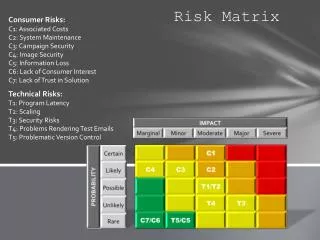
Risk Matrix Summary *C1 = Water body impairment, C2 = Designated usage, C3 = Biotic impact, C4 = Potential human impact, C5 = Urban suburban population, C6 = Impervious surface, C7 = Economic activity, C8 = Cropland, C9 = Livestock and pasture, C10 = Unpaved roads, C11 = Forestry, C12 = Adjacent state priority ANRC Task Force Meeting, September 21, 2010
Selected Priority Watersheds ANRC Task Force Meeting, September 21, 2010
Selected Priority Watersheds ANRC Task Force Meeting, September 21, 2010
Questions/Discussions ANRC Task Force Meeting, September 21, 2010