Download
1 / 35
350 likes | 453 Views
IPCC 4 th Assessment Report: WG1: Physical Science Basis Chapter 2. Greenhouse Gas Concentrations. IPCC 4 th Assessment WG1. Keeling Curve of CO2. http://cdiac.ornl.gov/trends/co2/sio-mlo.htm. Radiative Forcing. IPCC 4 th Assessment WG1. Aerosol Effects. IPCC 4 th Assessment WG1.

E N D
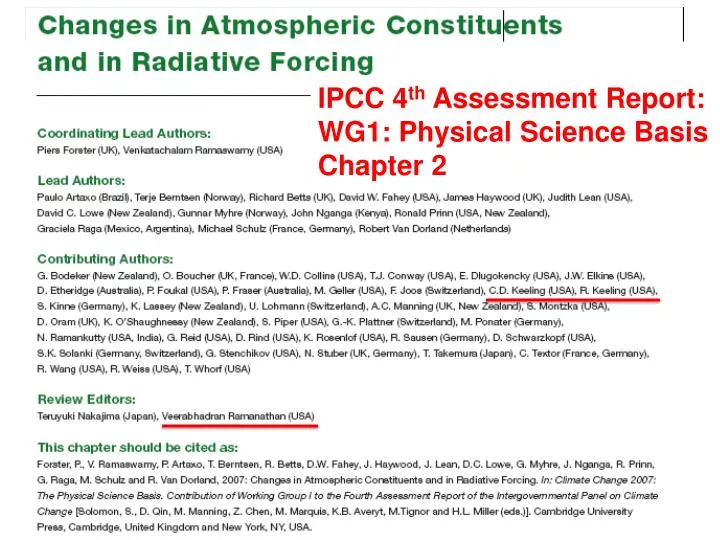
IPCC 4th Assessment Report: WG1: Physical Science Basis Chapter 2
Greenhouse Gas Concentrations IPCC 4th Assessment WG1
Keeling Curve of CO2 http://cdiac.ornl.gov/trends/co2/sio-mlo.htm
Radiative Forcing IPCC 4th Assessment WG1
Aerosol Effects IPCC 4th Assessment WG1
Satellite Aerosol Optical Depth IPCC 4th Assessment WG1
The fraction of CO2 remaining in the air, after emission by fossil fuel burning, declines rapidly at first, but 1/3 remains in the air after a century and 1/5 after a millennium (Atmos. Chem. Phys.7, 2287-2312, 2007).
Metrics for “Dangerous” Change Extermination of Animal & Plant Species 1. Extinction of Polar and Alpine Species 2. Unsustainable Migration Rates Ice Sheet Disintegration: Global Sea Level 1. Long-Term Change from Paleoclimate Data 2. Ice Sheet Response Time Regional Climate Disruptions 1. Increase of Extreme Events 2. Shifting Zones/Freshwater Shortages
Tipping Point Definitions 1. Tipping Level - Climate forcing (greenhouse gas amount) reaches a point such that no additional forcing is required for large climate change and impacts 2. Point of No Return - Climate system reaches a point with unstoppable irreversible climate impacts (irreversible on a practical time scale) Example: disintegration of large ice sheet
Impacts by Region IPCC WG2
Observations: Domingues, C.M. et al., Nature 453, 1090-1093, 2008. Model: Hansen, J. et al., Science 308, 1431-1435, 2005.
9 8 7 6 5 4 Extent (million sq km) 2007 1978 1982 1986 1990 1994 1998 2002 2006
Surface Melt on Greenland Melt descending into a moulin, a vertical shaft carrying water to ice sheet base. Source: Roger Braithwaite, University of Manchester (UK)
Greenland Total Melt Area – 2007 value exceeds last maximum by 10% Konrad Steffen and Russell Huff, CIRES, University of Colorado at Boulder
Arctic Sea IceCriterion* 1. Restore Planetary Energy Balance CO2: 385 ppm 325-355 ppm 2. Restore Sea Ice: Aim for -0.5 W/m2 CO2: 385 ppm 300-325 ppm Range based on uncertainty in present planetary energy imbalance (between 0.5 and 1 W/m2) *Assuming near-balance among non-CO2 forcings
Jakobshavn Ice Stream in Greenland Discharge from major Greenland ice streams is accelerating markedly. Source: Prof. Konrad Steffen, Univ. of Colorado
Rongbuk Glacier Rongbuk glacier in 1968 (top) and 2007. The largest glacier on Mount Everest’s northern slopes feeds Rongbuk River.
Cenozoic Era 65 Million Years Ago Present Day Global Climate Forcings External (solar irradiance): +1 W/m2 Surface (continent locations): ~1 W/m2 Atmosphere (CO2 changes): > 10 W/m2
Summary: Cenozoic Era 1. Dominant Forcing: Natural ΔCO2 - Rate ~100 ppm/My (0.0001 ppm/year) - Human-made rate today: ~2 ppm/year Humans Overwhelm Slow Geologic Changes 2. Climate Sensitivity High - Antarctic ice forms if CO2 < ~450 ppm - Ice sheet formation reversible Humans Could Produce “A Different Planet”
GHG Emissions IPCC WG3