Download
1 / 18
180 likes | 196 Views
This study examines the effects of 20th century warming and climate variability on flood risk in the Western U.S., using temperature and precipitation data. It shows that flood risks have been decreasing overall, but increasing in some areas due to changes in snowpack and basin size. The study also explores the relationship between cool season precipitation variability and flood risk.

E N D
Effects of 20th Century Warming and Climate Variability on Flood Risk in the Western U.S.. Alan F. Hamlet Dennis P. Lettenmaier University of Washington
Cool Season Climate of the Western U.S. PNW GB CA CRB DJF Temp (°C) NDJFM Precip (mm)
Global T as a Predictive Variable for TMAX Trends Over the West TMAX R2 = 0.62
Global T as a Predictive Variable for Cool Season TMIN Trends Over the West TMIN R2 = 0.81
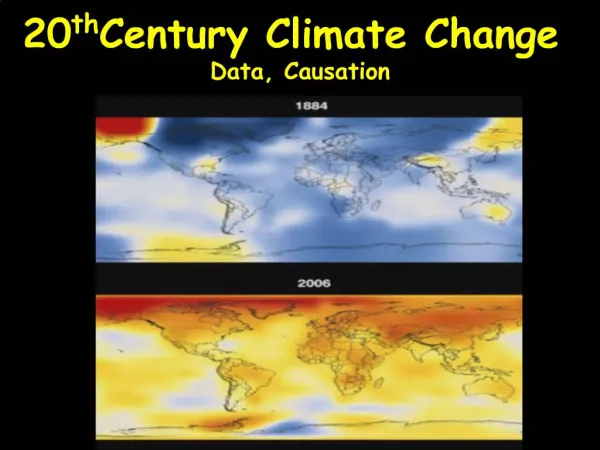
Temperatures in the Western U.S. Have Been Increasing Rapidly in the 20th Century, particularly in winter. Tmax Linear Trends in regionally averaged, monthly average Tmax and Tmin from 1916-2003. PNW Tmin GB CA CRB Data: Hamlet A.F., Lettenmaier D.P., 2005: Producing temporally consistent daily precipitation and temperature fields for the continental U.S., J. of Hydrometeorology, 6(3): 330-336
Regionally Averaged Cool Season Precipitation Anomalies PRECIP
Predominant Mechanisms Associated with Climate Related Changes in Flood Risk Snowmelt Dominant Rivers: Changes in spring peak snowpacks Transient Snow Rivers: Changes in antecedent snowpack at the time of storm Change in effective basin area due to rain/snow area distribution during storm Changes in storm intensity Rain Dominant Rivers: Changes in antecedent soil moisture Changes in storm intensity
PNW GB CA CRB Schematic of VIC Hydrologic Model and Energy Balance Snow Model Snow Model
Detrended Temperature Driving Data for Flood Risk Experiments “Pivot 2003” Data Set Early record warmer Temperature Historic temperature trend in each calendar month Recent record cooler “Pivot 1915” Data Set 2003 1915
Use of a Hydrologic Model with Long Precipitation and Temperature Records • Meteorological Records from 1915-2003 • De-trended Temperatures • Observed Precipitation Variability VIC Hydrology Model Variability of Daily Runoff In Different River Basin Types for A Consistent “Early” and “Late” 20th Century Temperature Regime
Simulated Changes in the 20-year Flood Associated with 20th Century Warming 1550 km2 DJF Avg Temp (C) X20 2003 / X20 1915 DJF Avg Temp (C) X20 2003 / X20 1915 X20 2003 / X20 1915
1550 km2 6500 km2 26000 km2 X100 2003 / X100 1915 X100 2003 / X100 1915 X100 2003 / X100 1915 DJF Avg Temp (C) DJF Avg Temp (C) DJF Avg Temp (C) X100 2003 / X100 1915 X100 2003 / X100 1915 X100 2003 / X100 1915
Regionally Averaged Cool Season Precipitation Anomalies PRECIP
20-year Flood for “1973-2003” Compared to “1916-2003” for a Constant Late 20th Century Temperature Regime DJF Avg Temp (C) X20 ’73-’03 / X20 ’16-’03 X20 ’73-’03 / X20 ’16-’03
Summary and Conclusions • The effects of warming on flood risk are related to mid-winter temperature regimes in each basin in the West. • Flood risks appear to be declining overall in the West due to systematic warming, but the simulations suggest that flood risks are increasing in many moderate elevation areas where tradeoffs between loss of antecedent snow and increasing basin size favor increasing basin size (mostly in coastal areas of WA, OR, and CA). • Changes in cool season precipitation variability since the mid 1970s have resulted in substantial increases in flood risk in many areas of the West. Are these related to warming?
Evaluating the Hydrologic Model Simulations in the Context of Reproducing Flood Characteristics Ln (X100 / Xmean) OBS Avg WY Date of Flooding OBS Avg WY Date of Flooding VIC Ln (X100 / Xmean) VIC Red = PNW, Blue = CA, Green = Colo, Black = GB
100-yr Red = VIC Blue = OBS 50-yr X100 GEV flood/mean flood 20-yr 10-yr 5-yr Zp