Download
1 / 24
240 likes | 329 Views
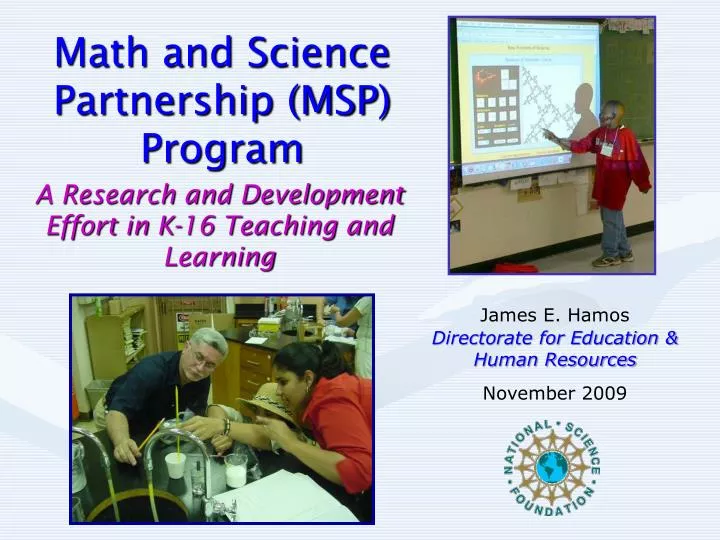
Math and Science Partnership (MSP) Program. A Research and Development Effort in K-16 Teaching and Learning. James E. Hamos Directorate for Education & Human Resources November 2009.

E N D
Math and Science Partnership (MSP) Program A Research and Development Effort in K-16 Teaching and Learning James E. Hamos Directorate for Education & Human Resources November 2009
A research & development effort at NSF for building capacity and integrating the work of higher education with that of K-12 to strengthen and reform mathematics and science education Launched in FY 2002 as a result of legislative interest and was also a key facet of the President’s NCLB vision for K-12 education Reauthorized as part of the America COMPETES Act of 2007 and provided with additional appropriation in the American Recovery and Reinvestment Actof 2009 and the FY 2009 federal budget NSF’s Math and Science Partnership
What distinguishes NSF’s MSP Program? Substantial intellectual engagement of mathematicians, scientists and engineers from higher education in improving K-12 student outcomes in mathematics and the sciences Depth and quality of creative, strategic actions that extend beyond commonplace approaches
What distinguishes NSF’s MSP Program? • Breadth and depth of Partnerships – Partnerships between organizations, rather than among individuals only • Degree to which MSP work is integrated with evidence; degree to which the work of the Partnerships is itself the work of scholars who seek evidence for what they do • Organizational/institutional change driven by Partnerships
Through the Math and Science Partnership program, NSF awards competitive, merit-based grants to teams composed of institutions of higher education, local K-12 school systems and supporting partners. At their core, Partnerships contain at least one institution of higher education and one K-12 school system.
145 Funded MSP Projects 12 ComprehensivePartnerships (FY 2002, FY 2003) 36 TargetedPartnerships(FY 2002, FY 2003, FY 2004, FY 2008) 23 Institute Partnerships(Prototype Award in FY 2003, FY 2004, FY 2006, FY 2008, FY 2009) 19 MSP-StartPartnerships(FY 2008, FY2009) 6 Phase IIPartnerships(FY 2008, FY 2009) 49 RETAprojects (Design Awards in FY 2002, FY 2003, FY 2004, FY 2006, FY 2008, FY 2009)
Math and Science Partnership (MSP) Program National Distribution of Partnership Activity
Scope of Partnership Projects • Over 800 K-12 school districts • ~5 million students • ~147,000 teachers of K-12 math and science • 198 institutions of higher education • Over 2600 faculty, administrators, graduate and undergraduate students
Examining Student Achievement • Year-by-Year Trend Analysis • Matched comparisons • Meta-analysis pre/post assessments Closing the Achievement Gap
What are we learning? Through new long-term and coherent courses and programs, the involvement of STEM faculty and their departments in pre- and in-service education enhances content knowledge of teachers
North Cascades and Olympic Science Partnership Impact on Teacher Leaders’ Content Knowledge Impact on the Students of Teacher Leaders Students who have NCOSP teacher leaders for one and two years of instruction are more likely to score proficient on state assessments than students who do not have such a teacher.
What are we learning? MSP projects are making new contributions to the STEM education literature related to teacher content knowledge and teacher leadership
Teacher Content Knowledge & Teacher Leadership http://www.mspkmd.net/
What are we learning? STEM professional learning communities are new exemplars in professional development
What are we learning? STEM education can and should extend beyond science and mathematics; in particular, K-12 engineering education is ready for prime time
What are we learning? Research methods in ethnography and social network analysis help document change in institutions and partnerships
Milwaukee Mathematics Partnership School with High Distributed Leadership School with Emerging Distributed Leadership • Distance is important. Closer nodes are more tightly connected than nodes that are further apart. • Color is important. Individuals from the subject school are colored red and those who are not at the school are green. The MTL for each school is colored yellow. • Shape denotes role as follows: Diamond = MTL; Overlapping Triangles = Principal; Up Triangle = Literacy Coach; Down Triangle = MTS; Square = Teacher; Circle = Other role
What are we learning? Higher education STEM faculty, often with the aid of teachers-in-residence on college campuses, are broadening their discussions of teaching and learning and supporting new efforts in teacher preparation
What are we learning? New centers and institutes devoted to K-16 math and science education facilitate interactions between higher education and K-12, offer professional development for STEM faculty, and advance the scholarship of teaching and learning
What are we learning? Revised tenure & promotion policies recognize faculty for scholarly contributions to the advancement of math and science education
University of Georgia System - PRISM • Institutes on the Teaching and Learning of Science and Mathematics • Faculty support through mini-grants to encourage modifications in introductory courses to include more active learning strategies Faculty driven change has resulted in increase learning for undergraduates
Using the Inventory of Teaching and Learning (ITAL), PRISM has studied whether or not participation in learning communities (LCs) increases K-12 teachers’ uses of varied teaching practices in science and/or mathematics classes, and if having an IHE faculty member engaged in LCs increases teachers’ uses of varied teaching practices. In a 2006 study, based on ITAL data from over 4000 STEM teachers, those who participated in PRISM LCs reported greater emphasis on standards-based teaching and learning practices than those who did not. Moreover, teachers who participated in PRISM LCs that had IHE faculty members reported greater emphasis on both inquiry-based and standards-based teaching and learning practices than participants in PRISM LCs that did not have higher education involvement. Improved Science Scores – GA High School Graduation Test 100% of PRISM districts increased pass rates from 2004-2005.In 2004, only 1 PRISM district had a pass rate greater than 75%; in 2006 – 8 had pass rates greater than 75%. 2003-04 2004-05 2005-06 7 PRISM Districts pass rate the state average pass rate (68%) 9 PRISM Districts pass rate the state average pass rate (68%) 10 PRISM Districts pass rate the state average pass rate (73%)
In this solicitation, NSF will likely support six types of awards: Partnerships Targeted Institute MSP-Start Phase II Research, Evaluation and Technical Assistance(RETA) Innovation through InstitutionalIntegration(I3) FY’10 MSP Solicitation NSF 10-XXX
Website for MSP at NSF http://www.nsf.gov Click on Program Area – Education Click on Division of Undergraduate Education (DUE) Click on Math and Science Partnership Program Website for MSPnet http://mspnet.org