Download
1 / 18
180 likes | 281 Views
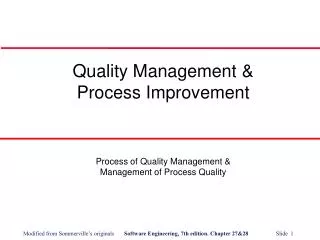
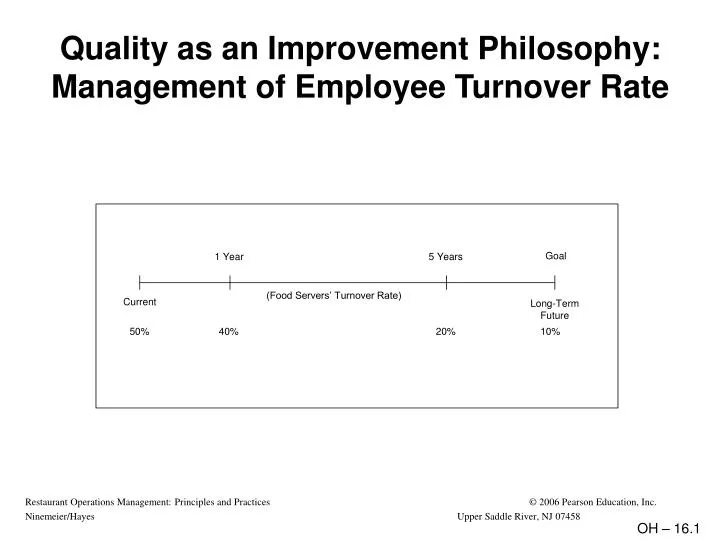
Goal. 1 Year. 5 Years. Current. Long-Term Future. 50%. 40%. 20%. 10%. Quality as an Improvement Philosophy: Management of Employee Turnover Rate. (Food Servers’ Turnover Rate). OH – 16.1. Effective Restaurant Managers:. Can never be content about “how things are now”

E N D
Goal 1 Year 5 Years Current Long-Term Future 50% 40% 20% 10% Quality as an Improvement Philosophy: Management of Employee Turnover Rate • (Food Servers’ Turnover Rate) OH – 16.1
Effective Restaurant Managers: • Can never be content about “how things are now” • Must be concerned about ways to make improvements in their operations • Must utilize the present situation as the benchmark (starting point) for planning an improvement process OH – 16.2
Calculation of Actual Food and Beverage Costs with Adjustments for January, 20XX OH – 16.3
Calculation of Actual Food and Beverage Costs with Adjustments for January, 20XX (continued) OH – 16.4
All About Food and Beverage Transfers OH – 16.5
Set Expectations Assess the “Actuals” Analyze the Variance Determine Whether Problem Exists Steps in Problem Analysis Process Step 1: Step 2: Step 3: Step 4: OH – 16.6
“It's All in the Numbers” OH – 16.7
Revenue Levels Impact Food and Labor Cost Percentages OH – 16.8
Potential Reasons for Revenue Problems OH – 16.9
Potential Reasons for Food Cost Problems [1] The food cost percentage is a function of food costs divided by revenue; therefore, revenue theft yields a higher food cost percentage. The real problem could be theft of revenue rather than excess funds being spent for food. [2] See discussion of actual food cost calculations earlier in this chapter. OH – 16.10
Recap: Food Server Guest Check Averages OH – 16.11
Worksheet for Weekly Food Cost OH – 16.12
Labor Cost Analysis OH – 16.13
Consider Problems Identified by Analysis Prioritize Problems Unmanageable Manageable Utilize a Decision-Making Process Steps in Corrective Action Process Step 1: Step 2: Step 3: OH – 16.14
Prioritizing Problems: Assess the Economic Impact • Would you rather increase revenue or decrease variable costs? (Answer: Ideally both!) What about in the example below? • Priority: To increase revenue by $2,000 or to decrease variable costs by $2,000. Increasing revenue by $2,000 only yields a $600 increase in profit ($1,800 - $1,200); decreasing variable costs by $2,000 increased profit by $2,000 ($3,200 - $1,200). OH – 16.15
More on Prioritizing Problems: Assess the Economic Impact B. Which of the following costs would you first “manage”? (Answer: Hopefully both at the same time!) If not, which is the priority? At first examination, it appears “obvious” that beverage costs represent the biggest problem: a 5% variance from expected costs compared to only 1% variance for food costs. However, after we learn more details, our opinion of the largest problem changes FOOD BEVERAGE As seen above, a 2% variance in food costs represents $9,000 in higher-than-expected costs (and lower profits). By contrast, a 5% variance in beverage costs results in $5,250 in higher-than-expected costs (and lower profits). Clearly, after any “quick fix” with the beverage operation, the manager's attention must be directed to food control activities. OH – 16.16
Basics of the Decision-Making (Problem-Solving) Process OH – 16.17
Some Tactics to Reduce Resistance to Change • Involve employees in the decision-making process. • Inform employees in advance about changes that will impact them. • Select an appropriate time to implement the change. (“Trying something new” during an extremely busy shift is never a good idea!) • Share past successes; review related changes that have benefited the employees and the organization. • Reward employees for sharing ideas in the decision-making process that benefit the restaurant and the employees. OH – 16.18