Download
1 / 19
200 likes | 310 Views
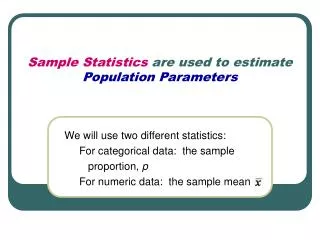
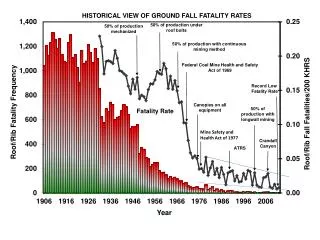
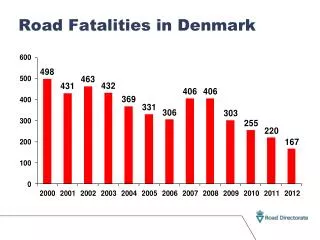
Statistical model used to estimate road traffic fatalities. Kacem Iaych World Health Organization July 2011. The methodology used to collect data Negative binomial regression Outputs Next steps. Outline. Methodology used for data collection. What is the research problem?.

E N D
Statistical model used to estimate road traffic fatalities Kacem Iaych World Health Organization July 2011
The methodology used to collect data Negative binomial regression Outputs Next steps Outline
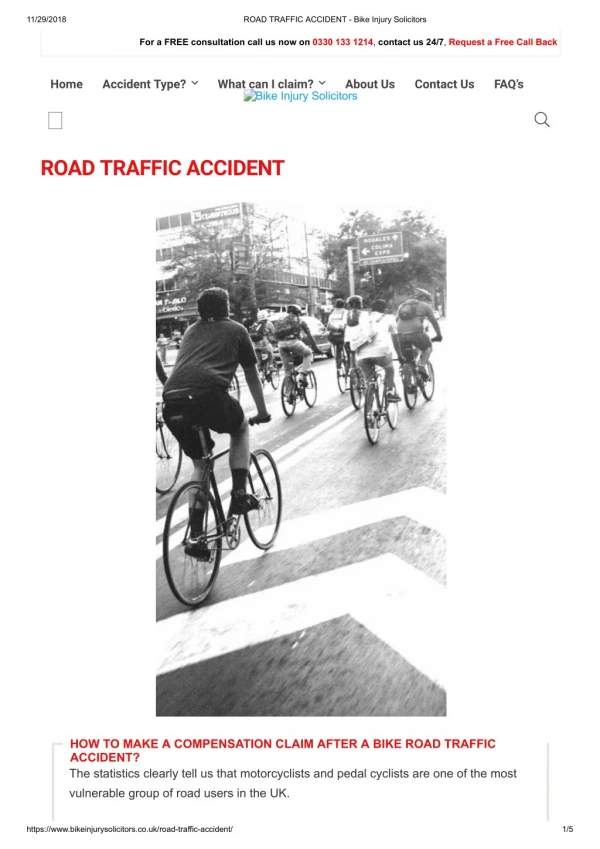
What is the research problem? • Estimation of road traffic fatalities in view of underreporting of fatalities in data collected • Present reported data or improve on underreporting and derive estimates? • If estimating • which statistical model to use? • which variables to use?
We decided to estimate: how did we do it? • Started with 30-day definition adjustment
Countries group based on VR completeness • Group 1 : VR completeness >= 85% (37HICs,36MICs,24LICs) • Group 2: VR completeness <85% (3HICs, 48MICs, 43 LICs)
Selected appropriate statistical model:negative binomial distribution • The model can be expressed in mathematical form as follows: RTF = FUNCT(Xj1,…, X j10)
The mean in this case is represented as follows: 1. μ*j=exp(β0 + β1 × xj1 + ··· +βn × xjn )×population. 2. Log(μ*j )= β0 + β1 × xj1 + ··· +βn × xjn+log(population).
Framework for determinants of traffic injury mortality Determinants of traffic accident mortality Exposure factors: -Car density -Road density Risk factors, Preventive moderating measures Policies on specific interventions and their enforcement -alcohol -speed -Investment on public transport Mitigating factors Strength of health system such as the presence of pre-hospital care, emergency care Independent variables Income Traffic accident mortality (Outcome Yj)
X j1 = Income X j2 = Car density X j3 = Road density X j4 = Helmet law X j5 = National policies that encourage walking and/or cycling X j6 = National policies that support investment in public transport X j7 = National speed limits on urban roads X j8 = National speed limits on rural roads X j9 = Alcohol consumption X j10 =Hospital beds (per 10 000 population)
Outputs Main messages Global health observatory Country profiles Statistical annexes Statistical annexes Supporting docs
Any refinement of the model? • Include some additional variables • Perhaps improve our model using elements of the GBD model
Cameron AC, Trivedi PK. Regression analysis of count data. Econometric Society Monograph, No. 30. New York, Cambridge University Press, 1998. • Takeuchi, H. (2001). On the likelihood ratio test for a single model against the mixture of two known densities. Communications in Statistics-Theory and Methods 30, 931-942. • Cameron AC, Trivedi PK. Regression analysis of count data. Econometric Society Monograph, No. 30. New York, Cambridge University Press, 1998. • Hilbe JM. Negative Binomial Regression. Cambridge University Press, Cambridge, 2007. • Razzak JA, Luby SP. “Estimating deaths and injuries due to road traffic accidents in Karachi, Pakistan, through the capture-recapture method.” International Journal of Epidemiology, 1998:27:866-870. • Greenwood M, Yule, GU. An enquiry into the nature of frequency distributions representative of multiple happenings with particular reference to the occurrence of multiple attacks of disease or of repeated accidents. Journal of the Royal Statistical Society, 1920; Series A: 83: 255-279. • The Global Burden of Disease: 2004 update. Geneva, World Health Organization, 2008 (http://www.who.int/healthinfo/global_burden_disease/GBD_report_2004_update_AnnexA.pdf, accessed 7 April 2009).
Thank you for your attention iaychk@who.int