Download
1 / 1
10 likes | 156 Views
(K). 6. 5 4. Cirrus. T 4 - T5 (BTD). 4. 3. Clear area or Unclassified. 2. Dense Cirrus. Cu. 1. Cb. Cloud type graph. 220. 230. 240. 250. 260. 270. 280. 290 (K). 11- m m Brightness Temperature ( T B ). Cloud type graph. Cloud type graph. Abstract

E N D
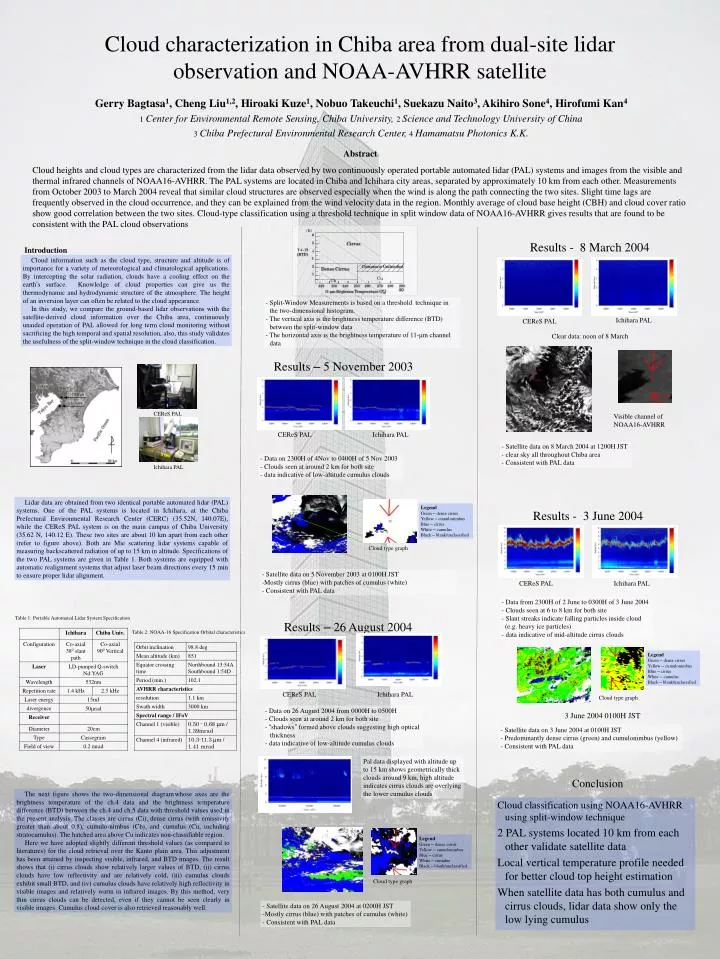
(K) 6 5 4 Cirrus T 4 - T5 (BTD) 4 3 Clear area or Unclassified 2 Dense Cirrus Cu 1 Cb Cloud type graph 220 230 240 250 260 270 280 290 (K) 11-mm Brightness Temperature (TB) Cloud type graph Cloud type graph Abstract Cloud heights and cloud types are characterized from the lidar data observed by two continuously operated portable automated lidar (PAL) systems and images from the visible and thermal infrared channels of NOAA16-AVHRR. The PAL systems are located in Chiba and Ichihara city areas, separated by approximately 10 km from each other. Measurements from October 2003 to March 2004 reveal that similar cloud structures are observed especially when the wind is along the path connecting the two sites. Slight time lags are frequently observed in the cloud occurrence, and they can be explained from the wind velocity data in the region. Monthly average of cloud base height (CBH) and cloud cover ratio show good correlation between the two sites. Cloud-type classification using a threshold technique in split window data of NOAA16-AVHRR gives results that are found to be consistent with the PAL cloud observations Cloud characterization in Chiba area from dual-site lidar observation and NOAA-AVHRR satellite Results - 8 March 2004 Introduction Cloud information such as the cloud type, structure and altitude is of importance for a variety of meteorological and climatological applications. By intercepting the solar radiation, clouds have a cooling effect on the earth’s surface. Knowledge of cloud properties can give us the thermodynamic and hydrodynamic structure of the atmosphere. The height of an inversion layer can often be related to the cloud appearance. In this study, we compare the ground-based lidar observations with the satellite-derived cloud information over the Chiba area, continuously unaided operation of PAL allowed for long term cloud monitoring without sacrificing the high temporal and spatial resolution, also, this study validates the usefulness of the split-window technique in the cloud classification. - Split-Window Measurements is based on a threshold technique in the two-dimensional histogram. - The vertical axis is the brightness temperature difference (BTD) between the split-window data - The horizontal axis is the brightness temperature of 11-μm channel data IchiharaPAL CEReSPAL Clear data: noon of 8 March Results – 5 November 2003 CEReS PAL Visible channel of NOAA16-AVHRR CEReSPAL IchiharaPAL • Satellite data on 8 March 2004 at 1200H JST • clear sky all throughout Chiba area • Consistent with PAL data • Data on 2300H of 4Nov to 0400H of 5 Nov 2003 • Clouds seen at around 2 km for both site • data indicative of low-altitude cumulus clouds Ichihara PAL Lidar data are obtained from two identical portable automated lidar (PAL) systems. One of the PAL systems is located in Ichihara, at the Chiba Prefectural Environmental Research Center (CERC) (35.52N, 140.07E), while the CEReS PAL system is on the main campus of Chiba University (35.62 N, 140.12 E).These two sites are about 10 km apart from each other (refer to figure above). Both are Mie scattering lidar systems capable of measuring backscattered radiation of up to 15 km in altitude. Specifications of the two PAL systems are given in Table 1. Both systems are equipped with automatic realignment systems that adjust laser beam directions every 15 min to ensure proper lidar alignment. Legend Green – dense cirrus Yellow – cumulonimbus Blue – cirrus White – cumulus Black – blank/unclassified Gerry Bagtasa1, Cheng Liu1,2, Hiroaki Kuze1, Nobuo Takeuchi1, Suekazu Naito3, Akihiro Sone4, Hirofumi Kan4 1 Center for Environmental Remote Sensing, Chiba University, 2 Science and Technology University of China 3 Chiba Prefectural Environmental Research Center, 4 Hamamatsu Photonics K.K. Results - 3 June 2004 • Satellite data on 5 November 2003 at 0100H JST • Mostly cirrus (blue) with patches of cumulus (white) • Consistent with PAL data CEReSPAL IchiharaPAL • Data from 2300H of 2 June to 0300H of 3 June 2004 • Clouds seen at 6 to 8 km for both site • Slant streaks indicate falling particles inside cloud • (e.g. heavy ice particles) • data indicative of mid-altitude cirrus clouds Table 1: Portable Automated Lidar System Specification Results – 26 August 2004 Table 2: NOAA-16 Specification Orbital characteristics Legend Green – dense cirrus Yellow – cumulonimbus Blue – cirrus White – cumulus Black – blank/unclassified CEReSPAL IchiharaPAL • Data on 26 August 2004 from 0000H to 0500H • Clouds seen at around 2 km for both site • “shadows” formed above clouds suggesting high optical • thickness • - data indicative of low-altitude cumulus clouds 3 June 2004 0100H JST • Satellite data on 3 June 2004 at 0100H JST • Predominantly dense cirrus (green) and cumulonimbus (yellow) • Consistent with PAL data Pal data displayed with altitude up to 15 km shows geometrically thick clouds around 9 km, high altitude indicates cirrus clouds are overlying the lower cumulus clouds Conclusion The next figure shows the two-dimensional diagramwhose axes are the brightness temperature of the ch.4 data and the brightness temperature difference (BTD) between the ch.4 and ch.5data with threshold values used in the present analysis. The classes are cirrus (Ci), dense cirrus (with emissivity greater than about 0.8), cumulo-nimbus (Cb), and cumulus (Cu, including stratocumulus). The hatched area above Cu indicates non-classifiable region. Here we have adopted slightly different threshold values (as compared to literatures) for the cloud retrieval over the Kanto plain area. This adjustment has been attained by inspecting visible, infrared, and BTD images. The result showsthat (i) cirrus clouds show relatively larger values of BTD, (ii) cirrus clouds have low reflectivity and are relatively cold, (iii) cumulus clouds exhibit small BTD, and (iv) cumulus clouds have relatively high reflectivity invisible images and relatively warm in infrared images. By this method, very thin cirrus clouds can be detected, even if they cannot be seen clearly in visible images.Cumulus cloud cover is also retrieved reasonably well. Cloud classification using NOAA16-AVHRR using split-window technique 2 PAL systems located 10 km from each other validate satellite data Local vertical temperature profile needed for better cloud top height estimation When satellite data has both cumulus and cirrus clouds, lidar data show only the low lying cumulus Legend Green – dense cirrus Yellow – cumulonimbus Blue – cirrus White – cumulus Black – blank/unclassified • Satellite data on 26 August 2004 at 0200H JST • Mostly cirrus (blue) with patches of cumulus (white) • Consistent with PAL data