Download
1 / 20
200 likes | 354 Views
Presentation Concepts 2 Giving Your Presentation. Objectives. Select and create appropriate and effective visuals Present your visuals effectively Choose an appropriate delivery method Prepare for questions from the audience. Objectives.

E N D
Presentation Concepts 2Giving Your Presentation New Perspectives on Microsoft Office 2003
Objectives • Select and create appropriate and effective visuals • Present your visuals effectively • Choose an appropriate delivery method • Prepare for questions from the audience New Perspectives on Microsoft Office 2007
Objectives • Overcome your nervousness and control your speaking anxiety • Improve your delivery • Analyze your nonverbal communication • Give a collaborative presentation • Set up for your presentation New Perspectives on Microsoft Office 2007
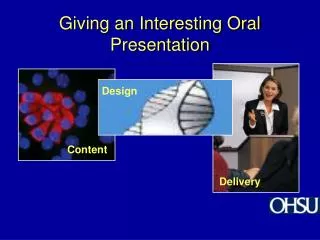
Benefits of Using Visuals • Increases your audience’s understanding • Helps listeners remember information • Highlights your organization • Adds credibility to your presentation • Stimulates and maintains your listeners’ attention • Varies the pace of your presentation • Keeps you on track New Perspectives on Microsoft Office 2007
Selecting Appropriate Visuals • Which visuals are suitable for my purpose and desired outcomes? • Which visuals would my audience understand? • Which visuals work best for the situation in which I’ll give my presentation? • Which visuals can I create effectively? New Perspectives on Microsoft Office 2007
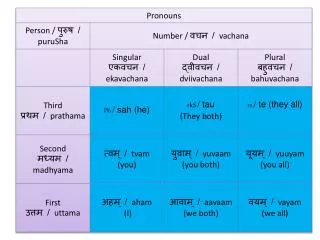
Using Tables • Tables are a visual method of organizing words and numerical data in horizontal rows and vertical columns. • Making facts and details accessible • Organizing data by categories • Summarizing results and recommendations • Comparing sets of data • Facilitating decisions New Perspectives on Microsoft Office 2007
Using Tables New Perspectives on Microsoft Office 2007
Using Graphs • Graphs show the relationship between two variables along two axes or reference lines. • Comparing one quantity to another • Showing changes over time • Indicating patterns or trends New Perspectives on Microsoft Office 2007
Using Graphs New Perspectives on Microsoft Office 2007
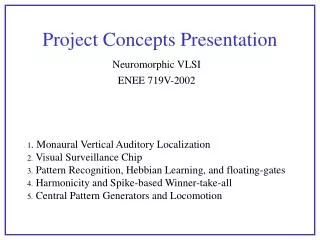
Using Charts • Charts are visuals that use lines, arrows, and boxes or other shapes to show parts, steps, or processes. • Pie charts • Organizational charts • Flowcharts New Perspectives on Microsoft Office 2007
Using Charts New Perspectives on Microsoft Office 2007
Using Illustrations • Illustrations are pictorial ways to represent parts and processes, consist of diagrams, drawings, maps, photographs, and clip art New Perspectives on Microsoft Office 2007
Determining Whether You Can Create Visuals • What are the expectations for my visuals? • How much time will I have to prepare the visuals? • Do I have adequate knowledge or expertise to create the visuals? • What computer equipment and other production resources do I have available for creating my own visuals? • How much money is budgeted to hire a technical illustrator or graphic artist? New Perspectives on Microsoft Office 2007
Choosing an Appropriate Delivery Method • Written vs. Memorized presentations • Much advance preparation • Extemporaneous presentations • Some advance preparation • Impromptu presentations • Little advance preparation, but difficult to give New Perspectives on Microsoft Office 2007
Preparing for Your Presentation • Prepare for questions from the audience • Overcome nervousness • Practice your presentation New Perspectives on Microsoft Office 2007
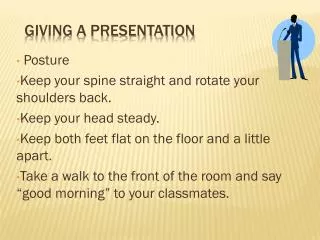
Improving Your Delivery • Establishing eye contact • Use a pleasant, natural voice New Perspectives on Microsoft Office 2007
Using Non-verbal Communication • Checking your appearance and posture • Using natural gestures and movement • Avoiding annoying mannerisms New Perspectives on Microsoft Office 2007
Presentation Delivery Worksheet New Perspectives on Microsoft Office 2007
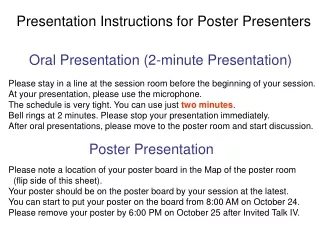
Facilities Checklist New Perspectives on Microsoft Office 2007
Evaluating Your Performance New Perspectives on Microsoft Office 2007