Download

1 / 22
220 likes | 267 Views
Explore income-consumption and income-saving relationships, average and marginal propensities, and non-income determinants affecting consumption and saving. Discover the impact of wealth, expectations, and interest rates, and learn about the interest rate-investment relationship. Gain insights into shifts in consumption and saving schedules, stability, and the critical role of real interest rates in investment decisions.

E N D
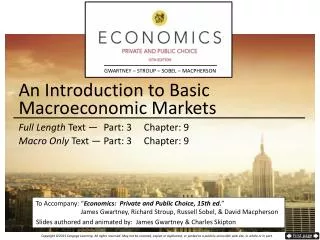
What Are the Basic Macro Relationships? • Three Basic Macroeconomic Relationships. • Income and Consumption, and income and saving. • The interest rate and investment • Changes in spending and changes in output
Income-Consumption and Income-Saving Relationships • Disposable income - most important determinant of consumer spending • Amount not spent = Saving • Disposable Income = DI • Consumption = C • Saving = S
Income-Consumption and Income-Saving Relationships • Households consume a large portion of their disposable income. • Both consumption and saving are directly related to the level of income.
Average and Marginal Propensities to Consumer and Save • Average Propensity to consume (APC) • The fraction or percentage of income consumed • (APC = Consumption/Income) • Average Propensity to Save (APS) • The fraction or percentage of income saved • (APS = saving/income) • Marginal Propensity to Consume (MPC) • The fraction or proportion of any change in income that is consumed. • (MPC = change in consumption/change in income) • Marginal Propensity to Save (MPS) • The fraction or proportion of any change in income that is saved. • (MPS = change in saving/ change in income)
Average and Marginal Propensities to Consumer and Save • APC + APS = 1 • MPC + MPS = 1
Non-income determinants of consumption and saving can cause people to spend or save more or less at various income levels • Although the level of income is the basic determinant. • Wealth • Expectations • Real interest rates • Household debt • Taxation
Wealth • An increase in wealth shifts the consumption schedule up and saving schedule down • Major fluctuations in stock market values have increased the importance of the wealth effect. • A “reverse wealth effect” occurred in 2000 and 2001, when stock prices fell dramatically
Expectations and Real Interest Rates • Changes in expected future prices or wealth can affect consumption spending today. • Declining interest rates increase the incentive to borrow and consume. • Also reduces the incentive to save • Many household expenditures are not interest sensitive (light bill, groceries, etc). • The effect of interest rate changes on spending are modest.
Household Debt and Taxation • Lower debt levels shift consumption schedule up and saving schedule down. • Lower taxes will shift both schedules up since taxation affects both spending and saving. • Vice versa for higher taxes
Terminology, Shifts and Stability • Terminology – Movement from one point to another on a given schedule is called a change in amount consumed. • A shift in the schedule is called a change in consumption. • Schedule Shifts – Consumption and saving schedules will always shift in opposite directions unless a shift is caused by a tax change. • Stability – Economists believe that consumption and saving schedules are generally stable unless deliberately shifted by government action.
Interest Rate – Investment Relationship • Investment consists of spending on new plants, capital equipment, machinery, inventories, construction, etc. • The investment decision weighs marginal benefits and marginal costs. • The expected rate of return is the marginal benefit and the interest rate – the cost of borrowing funds – represents the marginal cost.
Expected Rate of Return • Found by comparing the expected economic profit (total revenue minus total cost) to cost of investment to get the expected rate of return. • Textbook example: $100 expected profit on a $1000 investment, for a 10% expected rate of return. • Thus, the business would not want to pay more than a 10% interest rate on investment. • Remember: the Expected Rate of Return is not a guaranteed rate of return. • INVESTMENT CARRIES RISK
The Real Interest Rate (i)(Nominal rate corrected for expected inflation) • Real Interest Rate Determines the Cost of Investment • Interest rate represents either the cost of borrowed funds or the opportunity cost of investing your own funds, which is income forgone, • If Real Interest Rate exceeds the expected rate of return, the investment should not be made.
Interest Rate – Investment Relationship (cont.) • Investment demand Schedule, or curve, shows an inverse relationship between the interest rate and amount of investment • As long as expected return exceeds interest rate, investment is expected to be profitable
Interest Rate – Investment Relationship • Shifts in investment demand occur when any determinant apart from the interest rate changes. • Greater expected returns create more investment demand; shift curve to right. • The reverse causes a leftward shift.
Interest Rate – Investment Relationship • Acquisition, maintenance, and operating costs of capital goods may change. • Higher costs lower the expected return. • Business taxes may change • Increased taxes lower the expected return. • Technology may change • Technological change often involves lower costs, which would increase expected returns.
Interest Rate – Investment Relationship • Stock of capital goods on hand will affect new investment. • Abundant idle capital on hand because of weak demand or recent investment • New investments would be less profitable. • Expectations about future economic and political conditions, both in aggregate and in certain specific markets • Can Change the view of expected profits.
Interest Rate – Investment Relationship • Investment is a very unstable type of spending; “I” is more volatile than GDP. • Capital goods are durable, so spending can be postponed or not (This is unpredictable) • Innovation occurs irregularly. • Profits vary considerable. • Expectations can be easily changed.
The Multiplier Effect • The Multiplier Effect is: • Changes in spending ripple through the economy to generate larger changes in real GDP. • Multiplier = • Change in real GDP/initial change in spending
The Multiplier Effect • Three points to remember about the Multiplier Effect: • The initial change in spending is usually associated with investment, because it is so volatile. • The initial change refers to an upshift or downshift in the aggregate expenditures schedule due to a change in one of its components, like investment. • The multiplier works in both direction (up and down).
The Multiplier Effect • The Multiplier Effect is based on two facts: • The economy has continuous flows of expenditures - a ripple effect – in which income received by “Grant” comes from money spent by “Battaglia”. “Battaglia’s” income, in turn, came from money spent by “Mendoza, and so forth. • Any Change in income will cause both consumption and saving to vary in the same direction as the initial change in income, and by a fraction of that change - called marginal propensity to consume (MPC). The fraction of the change in income that is saved is called the marginal propensity to save (MPS)