Download
1 / 19
190 likes | 595 Views
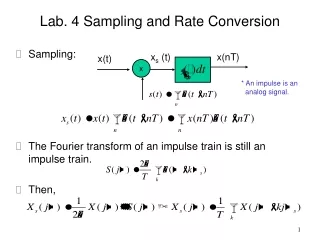
Quadrat sampling Quadrat shape Quadrat size Lab. ?. ?. ?. ?. ?. ?. Quadrat shape. 1. Edge effects. ?. best. worst. Quadrat shape. 2. Variance. 4. 5. 4. 1. best. Quadrat size. 1. Edge effects. ?. ?. ?. ?. ?. ?. 3/5 on edge. 3/8 on edge. best. worst.

E N D
Quadrat sampling • Quadrat shape • Quadrat size • Lab
? ? ? ? ? ? Quadrat shape 1. Edge effects ? best worst
Quadrat shape 2. Variance 4 5 4 1 best
Quadrat size 1. Edge effects ? ? ? ? ? ? 3/5 on edge 3/8 on edge best worst
Quadrat size 1. Edge effects Density Quadrat size
Quadrat size 2. Variance Low variance High variance
Quadrat size So should we always use as large a quadrat as possible? Tradeoff with cost (bigger quadrats take longer to sample)
Quadrat lab What is better quadrat shape? Square or rectangle? What is better quadrat size? 4, 9 ,16, 25 cm2 ? Does your answer differ with tree species (distribution differs)? 22cm 16 cm
Size affects this! • Quadrat lab • Use a cost (“time is money”): benefit (low variance) approach to determine the optimal quadrat size for 10 tree species. • Hendrick’s method • Wiegert’s method • Cost: • total time = time to locate quadrat + time to census quadrat • Benefit: • Variance
Quadrat lab Quadrats can also be used to determine spatial pattern! We will analyze our data for spatial pattern (only) in the computer lab next week (1-2pm).
Quadrat lab: points for discussion 1. You need to establish if any species shows a density gradient. How will you do this? 2. You will have a bit of time to do something extra; what would be useful? Group work fine here. 3. Rules: -if quadrat doesn’t fit on map -if leaves are one edge of quadrat
Regression Problem: to draw a straight line through the points that best explains the variance
Regression Problem: to draw a straight line through the points that best explains the variance
Regression Problem: to draw a straight line through the points that best explains the variance
Regression Test with F, just like ANOVA: Variance explained by x-variable / df Variance still unexplained / df Variance explained (change in line lengths2) Variance unexplained (residual line lengths2)
Regression Test with F, just like ANOVA: Variance explained by x-variable / df Variance still unexplained / df In regression, each x-variable will normally have 1 df
Regression Test with F, just like ANOVA: Variance explained by x-variable / df Variance still unexplained / df Essentially a cost: benefit analysis – Is the benefit in variance explained worth the cost in using up degrees of freedom?
Regression example Total variance for 32 data points is 300 units. An x-variable is then regressed against the data, accounting for 150 units of variance. • What is the R2? • What is the F ratio?
Regression example Total variance for 32 data points is 300 units. An x-variable is then regressed against the data, accounting for 150 units of variance. • What is the R2? • What is the F ratio? R2 = 150/300 = 0.5 F 1,30 = 150/1 = 15 300/30 Why is df error = 30?