Download
1 / 26
280 likes | 557 Views
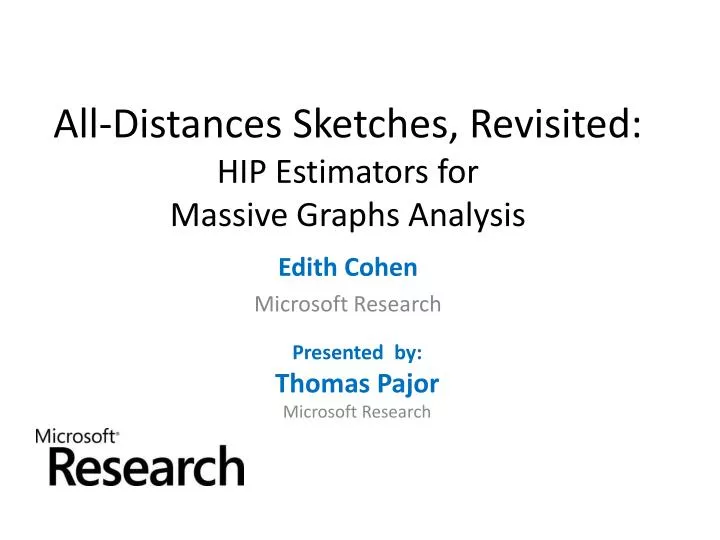
All-Distances Sketches, Revisited: HIP Estimators for Massive Graphs Analysis. Edith Cohen Microsoft Research . Presented by: Thomas Pajor Microsoft Research . Very Large Graphs. Model many types of relations and interactions Call detail data, email exchanges Web crawls

E N D
All-Distances Sketches, Revisited: HIP Estimators forMassive Graphs Analysis Edith Cohen Microsoft Research Presented by: Thomas Pajor Microsoft Research
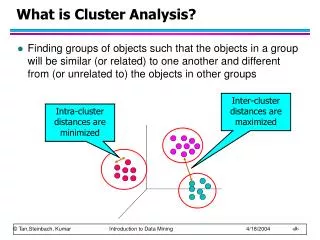
Very Large Graphs • Model many types of relations and interactions • Call detail data, email exchanges • Web crawls • Social Networks: Twitter, Facebook, linkedIn • Web searches, Commercial transactions,… • Need for scalable analytics: • Centralities/Influence(power/importance/coverage of a node or a set of nodes): Viral marketing,… • Similarities/Communities (how tightly related are 2 or more nodes): Recommendations, Advertising, Marketing
All-Distances Sketches (ADS) [C ‘94] • Summary structures: For each node : “samples” the distance relations of to all other nodes. Useful for queries involving a single node: Neighborhood cardinality and statistics • Sketches of different nodes are coordinated: related in a way that is useful for queries that involve multiple nodes (similarities, influence, distance)
All-Distances Sketches (ADS) [C ‘94]Basic properties • edges, nodes, parameter which controls trade-off between sketch size and information • ADSs work for directed or undirected graphs • Compact size: • Scalable Computation: lnedge traversals to compute for all nodes • Manyapplications
All-Distances Sketches: Definition is a list of pairs of the form • Draw a random permutation of the nodes: • < kthsmallest rank amongst nodes that are closer to than This is a bottom- ADS, it is the union of bottom- MinHash sketches ( smallest rank) of all “neighborhoods.” There are other ADS “flavors”, vary by the rank distribution (e.g. can use ) or sketch structure.
ADS example SP distances: 13 14 15 10 0 6 5 7 15 17 16 17 10 0.28 0.77 0.07 5 0.49 1 0.14 3 4 6 4 4 3 4 7 3 10 10 5 5 10 3 0.91 0.70 2 0.35 10 10 10 7 0.21 5 3 4 6 0.63 0.84 4 Random permutation of nodes 0.56 0.42
ADS example All nodes sorted by SP distance from 0.49 0.35 0.91 0.56 0.70 0.63 0.42 0.21 0.14 0.77 0.28 0.07 0.84 0.63 0.42 0.07 :
ADS example Sorted by SP distances from 0.49 0.35 0.91 0.56 0.70 0.63 0.42 0.21 0.14 0.77 0.28 0.07 0.84 0.63 0.42 0.14 0.35 0.56 0.21 0.07 :
“Basic” use of ADSs (90’s– 2013) Extract MinHashsketch of the neighborhood of , , from ADS: bottom- From MinHash sketches, we can estimate: • Cardinality • Estimate has CV (optimally uses the information in the MinHash sketch) • Jaccardsimilarity of and , • Other relations of and ,
Historic Inverse Probability (HIP) inclusion probability & estimator • For each node , we estimate the “presence” of with respect to (=1 if , 0 otherwise) • Estimate is if . • If , we compute the probability that it is included, conditioned on fixed rankvalues of all nodes that are closer to than We then use the inverse-probability estimate . [HT52] • This is unbiased (when ):
Bottom- HIP • For bottom- and HIP can be used with all flavors of MinHash sketches. Over distance (ADS) or time (Streams)
Example: HIP estimates Bottom- ADS of 0.63 0.42 0.14 0.35 0.56 0.21 0.07 : : :2nd smallest r value among closer nodes
HIP cardinality estimate Bottom- ADS of distance: : Query:
Quality of HIP cardinality Estimate Lemma: The HIP neighborhood cardinality estimator has CV This is improvement over “basic” estimators, which have CV See paper for the proof
HIP versus Basic estimators Basic X HIP
HIP: applications Querying ADSs: • Cardinality estimation: gain in relative error over “basic” (MinHash based) estimates • More complex queries: closeness centrality with topic awareness (gain can be polynomial) • Estimating relations (similarities, coverage) of pairs (sets) of nodes . Streaming: • Approximate distinct counting on streams.
Topic-aware Distance-decayCloseness Centrality • non increasing; some filter Centrality with respect to a filter • Topic, interests, education level, age, community, geography, language, product type • Applications for filter: attribute completion, targeted advertisements
….Closeness Centrality • non increasing; some filter • Polynomial (Harmonic) decay: • Exponential decay • Threshold ( ):
HIP estimates of Centrality • non increasing; some filter
HIP estimates: closeness to good/evil Bottom- ADS of distance: : : Filter: measures “goodness” Distance-decay:
Counting Distinct Elements on Data Stream 4, 32, 6, 12, 12, 14, 32, 7, 12, 32, 7, Elements occur multiple times, we want to count the number of distinctelements approximately with “small” storage, about • Best practical and theoretical algorithms maintain a MinHash sketch. Cardinality is estimated by applying an estimator to sketch [Flajolet Martin 85],… • Best (in practice) is the HyperLogLog(HLL) algorithm and variations. [Flajolet + FGM 2007],…
Counting Distinct Elements with HIP We maintain a MinHash sketch and an approximate counter -- variation on [Morris77]. The counter explicitly maintains an approximate distinct count. • Each time the sketch is updated ( times ), we increase the counter (add the HIP estimate for the inserted new distinct element) • The approximate countercan be represented with few bits (e.g., can be a relative correction to sketch-based estimate or share its “exponent”) This works with any MinHash sketch. In experiments, for comparison, we use the same sketch as HyperLogLog (HLL).
Conclusion • ADS: old but a very versatile and powerful tool for (scalable approximate) analytics on very large graphs: distance/similarity oracles, distance distribution, closeness, coverage, influence, tightness of communities • HIP: simple and practical technique, applicable with ADSs and streams Further ADS+HIP applications: • closeness similarity (using ADS+HIP) [CDFGGW COSN 2013] • … Timed-influence oracle
Ninjago Legends of Chima Nya “Samurai X” Acidicus Cragger Laval Kai “Ninja of Fire” Rascal Lloyd “The Green Ninja” Eris Star Wars Sensei Wu R2-D2 Darth Vader Yoda Luke Skywalker