Download
1 / 38
490 likes | 2.07k Views
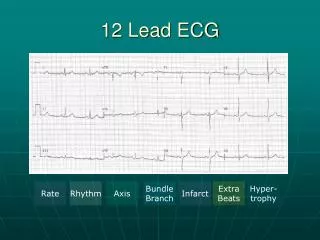
Essentials of 12 Lead ECG Interpretation. EMS Professionals Don Hudson, D.O.,FACEP/ACOEP . Topics . Anatomy Revisited The 12 Lead ECG Device The 12 Lead ECG Format Waveform Components Lead Views. Anatomy Revisited. RCA right ventricle inferior wall of LV posterior wall of LV (75%)

E N D
Essentials of 12 Lead ECG Interpretation EMS Professionals Don Hudson, D.O.,FACEP/ACOEP
Topics • Anatomy Revisited • The 12 Lead ECG Device • The 12 Lead ECG Format • Waveform Components • Lead Views
Anatomy Revisited • RCA • right ventricle • inferior wall of LV • posterior wall of LV (75%) • SA Node (60%) • AV Node (>80%) • LCA • septal wall of LV • anterior wall of LV • lateral wall of LV • posterior wall of LV (10%)
Anatomy Revisited • SA node • Intra-atrial pathways • AV node • Bundle of His • Left and Right bundle branches • left anterior fascicle • left posterior fascicle • Purkinje fibers
The 12 Lead ECG Device • Device serves as a voltmeter • measures the flow of electricity • Unipolar vs Bipolar Leads
Bipolar Leads • 1 positive and 1 negative electrode • RA always negative • LL always positive • Traditional limb leads are examples of these • Lead I • Lead II • Lead III • View from a vertical plane
Unipolar Leads • 1 positive electrode & 1 negative “reference point” • calculated by using summation of 2 negative leads • Augmented Limb Leads • aVR, aVF, aVL • view from a vertical plane • Precordial or Chest Leads • V1-V6 • view from a horizontal plane
The 12-Lead ECG Format Leads typically produced by devices used prehospital
The 12-Lead ECG Format Fields not typically produced by devices used prehospital
The 12-Lead ECG Format Device prints out 2.5 sec each of Leads I, II, III then switches to aVR, aVL, aVF then switches to V1, V2, V3 and then to V4, V5, V6 (varies by device) Device computer analyzes all 10 sec of all 12 leads but only prints 2.5 sec of each group
The 12-Lead ECG Format The computer diagnosis is not always accurate!!!
The 12-lead ECG Format The computer IS very accurate at measuring intervals & durations
Waveform Components: R Wave First positive deflection; R wave includes the downstroke returning to the baseline
Waveform Components: Q Wave First negative deflection before R wave; Q wave includes the negative downstroke & return to baseline
Waveform Components:S Wave Negative deflection following the R wave; S wave includes departure from & return to baseline
Waveform Components:QRS • Q waves • Can occur normally in several leads • Normal Q waves called physiologic • Physiologic Q waves • < .04 sec (40ms) • Pathologic Q • >.04 sec (40 ms)
Waveform Components:QRS • Q wave • Measure width • Pathologic if greater than or equal to 0.04 seconds (1 small box)
Waveform Components:QS Complex Entire complex is negatively deflected; No R wave present
Waveform Components:J-Point Junction between end of QRS and beginning of ST segment; Where QRS stops & makes a sudden sharp change of direction
Waveform Components: ST Segment Segment between J-point and beginning of T wave
Waveform Components: ST Segment • Need reference point • Compare to TP segment • DO NOT use PR segment as reference! ST TP
Waveform Components: Practice • Find J-points and ST segments
Waveform Components: Practice • Find J-points and ST segments
Lead Groups I aVR V1 V4 II aVL V2 V5 III aVF V3 V6 Limb Leads Chest Leads
Inferior Wall • II, III, aVF • View from Left Leg • inferior wall of left ventricle I II III aVR aVL aVF V1 V2 V3 V4 V5 V6
Inferior Wall • Posterior View • portion resting on diaphragm • ST elevation suspect inferior injury I II III aVR aVL aVF V1 V2 V3 V4 V5 V6 Inferior Wall
Lateral Wall • I and aVL • View from Left Arm • lateral wall of left ventricle I II III aVR aVL aVF V1 V2 V3 V4 V5 V6
Lateral Wall • V5 and V6 • Left lateral chest • lateral wall of left ventricle I II III aVR aVL aVF V1 V2 V3 V4 V5 V6
Lateral Wall • I, aVL, V5, V6 • ST elevation suspect lateral wall injury I II III aVR aVL aVF V1 V2 V3 V4 V5 V6 Lateral Wall
Anterior Wall • V3, V4 • Left anterior chest • electrode on anterior chest I II III aVR aVL aVF V1 V2 V3 V4 V5 V6
Anterior Wall • V3, V4 • ST segment elevation suspect anterior wall injury I II III aVR aVL aVF V1 V2 V3 V4 V5 V6
Septal Wall • V1, V2 • Along sternal borders • Look through right ventricle & see septal wall I II III aVR aVL aVF V1 V2 V3 V4 V5 V6
Septal • V1, V2 • septum is left ventricular tissue I II III aVR aVL aVF V1 V2 V3 V4 V5 V6
ST Segment Analysis For each complex, determine whether the ST segment is elevated one millimeter or more above the TP segment
12-Lead ECG • AMI recognition • Two things to know • What to look for • Where you are looking
AMI Recognition • What to look for • ST segment elevation • One millimeter or more (one small box) • Present in two anatomically contiguous leads
What next ? Now that you have some of the basics the next step is to teach you to evaluate the EKG from the standpoint of a variety of different injury patterns.