Download
1 / 1
10 likes | 140 Views
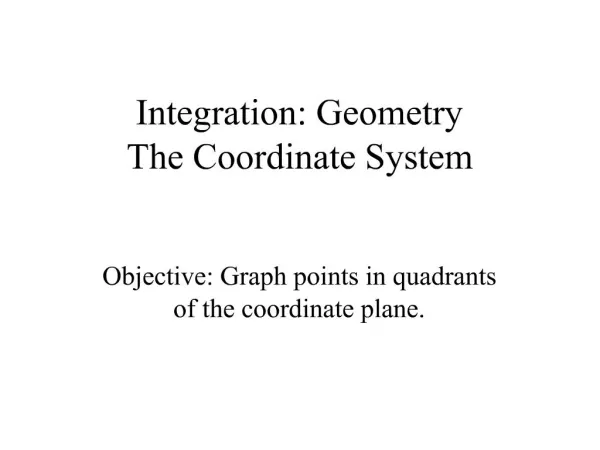
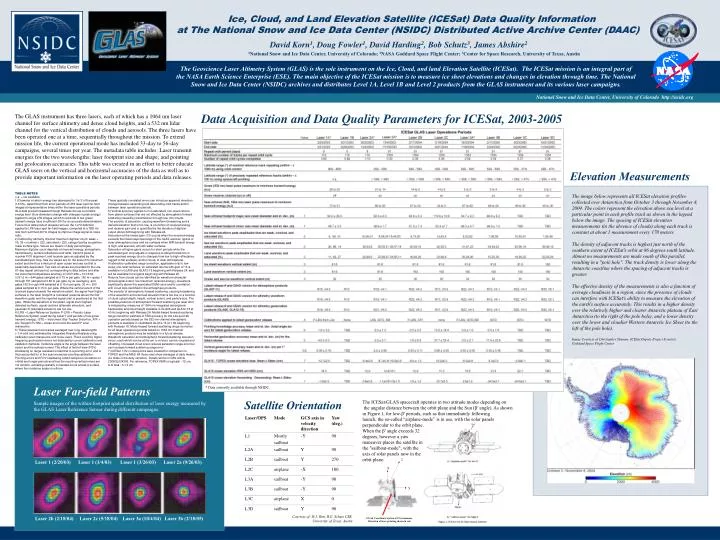
GLAS Coordinate System (GCS) summary. Direction of laser pointing shown in red. Ice, Cloud, and Land Elevation Satellite (ICESat) Data Quality Information at The National Snow and Ice Data Center (NSIDC) Distributed Active Archive Center (DAAC).

E N D
GLAS Coordinate System (GCS) summary. Direction of laser pointing shown in red. Ice, Cloud, and Land Elevation Satellite (ICESat) Data Quality Information at The National Snow and Ice Data Center (NSIDC) Distributed Active Archive Center (DAAC) David Korn1, Doug Fowler1, David Harding2, Bob Schutz3, James Abshire2 1National Snow and Ice Data Center, University of Colorado; 2NASA Goddard Space Flight Center; 3Center for Space Research, University of Texas, Austin The Geoscience Laser Altimetry System (GLAS) is the sole instrument on the Ice, Cloud, and land Elevation Satellite (ICESat). The ICESat mission is an integral part of the NASA Earth Science Enterprise (ESE). The main objective of the ICESat mission is to measure ice sheet elevations and changes in elevation through time. The National Snow and Ice Data Center (NSIDC) archives and distributes Level 1A, Level 1B and Level 2 products from the GLAS instrument and its various laser campaigns. National Snow and Ice Data Center, University of Colorado http://nsidc.org Data Acquisition and Data Quality Parameters for ICESat, 2003-2005 The GLAS instrument has three lasers, each of which has a 1064 nm laser channel for surface altimetry and dense cloud heights, and a 532 nm lidar channel for the vertical distribution of clouds and aerosols. The three lasers have been operated one at a time, sequentially throughout the mission. To extend mission life, the current operational mode has included 33-day to 56-day campaigns, several times per year.The metadata table includes: Laser transmit energies for the two wavelengths; laser footprint size and shape; and pointing and geolocation accuracies. This table was created in an effort to better educate GLAS users on the vertical and horizontal accuracies of the data as well as to provide important information on the laser operating periods and data releases. Elevation Measurements TABLE NOTES n.a. = not available 1) Diameter at which energy has decreased to 1/e^2 of the peak (13.5%), determined from short periods of LRS laser spot far-field images at representative times within the laser operations periods. GLA data product releases through Release 24 use a constant energy level (thus diameters change with changes in peak energy) applied to single LPA images (which for periods of low green transmit energy have insufficient S/N for an accurate determination). Future GLA data product releases will use the 1/e^2 definition applied to LPA laser spot far-field images, computed at a TBD Hz rate from summed 40 Hz images to improve image signal-to-noise ratio. 2) Defined by altimetry channel maximum digitizer count: weak < 35, 35 < nominal < 220, saturated > 220, categorized by acquisition mask surface type. Values are means of daily percentages. Maximum digitizer count depends on transmit energy, atmospheric transmissivity, surface reflectance and relief, transmit pulse to receiver FOV alignment, and receiver gain as adjusted by the automated gain loop. Sea ice values are for the area of its maximum extent and are thus a mixture of open ocean and sea ice that is seasonally dependent. Two sets of values are provided for the L2a 91-day repeat orbit period, corresponding to data before and after the instrument temperature anomaly on DOY 286 = 10/13/03. 3) 81.6 m = 544 gates sampled at 0.15 m per gate. 150 m = gates 1 through 151 sampled at 0.60 m per gate, by 4x averaging, and gates 152 through 544 sampled at 0.15 m per gate. 30 m = 200 gates sampled at 0.15 m per gate. Where the vertical extent of the received signal exceeds the waveform extent, the signal from higher surfaces in the laser footprint is truncated (extends above the first waveform gate) and the reported signal start is positioned at the first gate. When the waveform is truncated, signal start (highest detected surface), signal centroid (alternate elevation), and gaussian fit (standard elevation) are too low. 4) LRS = Laser Reference System, P-LRS = Pseudo-Laser Reference System (used during Laser 1 and periods of low green transmit energy), ISTD = Instrument Star Tracker Distortion, ATF = Arc-Tangent Fix SM = ocean and round-the-world 5° scan maneuvers 5) These represent accuracies averaged over long wavelengths (~1/4 orbit rev) estimated by Integrated Residual Analysis using calibration scan maneuvers and cross-overs. There could be higher frequency geolocation errors not detected by current calibration and validation methods. Incidence angle is the angle between the laser vector and the surface normal. The effect of field-of-view (FOV) shadowing on range residuals is identical to a pointing error, and is thus accounted for in the scan maneuver pointing calibration. Pointing errors and FOV shadowing exhibit temporal correlation on orbital and longer periods and thus the resulting vertical errors are not random, exhibiting spatially correlated errors across a surface where the incidence angle is uniform. The image below represents all ICESat elevation profiles collected over Antarctica from October 3 through November 8, 2004. The colors represent the elevation above sea level at a particular point in each profile track as shown in the legend below the image. The spacing of ICESat elevation measurements (in the absence of clouds) along each track is constant at about 1 measurement every 170 meters. The density of adjacent tracks is highest just north of the southern extent of ICESat's orbit at 86 degrees south latitude. Almost no measurements are made south of this parallel, resulting in a "pole hole". The track density is lower along the Antarctic coastline where the spacing of adjacent tracks is greater. The effective density of the measurements is also a function of average cloudiness in a region, since the presence of clouds can interfere with ICESat's ability to measure the elevation of the earth's surface accurately. This results in a higher density over the relatively higher and clearer Antarctic plateau of East Antarctica (to the right of the pole hole), and a lower density over the lower and cloudier Western Antarctic Ice Sheet (to the left of the pole hole). Image Courtesy of Christopher Shuman, ICESat Deputy Project Scientist,Goddard Space Flight Center These spatially correlated errors can introduce apparent elevation change between ascending and descending orbit tracks and/or between laser operations periods. 6) Vertical accuracy applies to non-saturated, non-cloud returns from planar surfaces that are not effected by atmospheric forward scattering caused by transmission through low, thin clouds. The severity of saturation, causing waveform broadening and a derived elevation that is too low, is a function of received energy and receiver gain and is quantified by the duration of digitizer output above 220 beginning with Release 24. Saturation at the lowest gain (13) occurs when the received energy exceeds the linear response range of the GLAS receiver, typical of clear-atmosphere snow and ice surfaces when NIR transmit energy is high, and specular, smooth water surfaces. Saturation at higher gains occurs for short periods while the automated gain loop adjusts in response to abrupt transitions in peak received energy (due to changes from low to high reflectance, rugged to flat surfaces, and/or cloudy to clear atmosphere). A laboratory-calibrated range correction, applicable only to low-slope, low-relief surfaces, for saturated returns with gain of 13 is available in GLA06 and GLA12-15 beginning with Release 24, and will be available for all gains beginning with Release 25. Returns from clouds can be identified by waveform character (broad signal extent; low maximum received energy), elevations significantly above the associated DEM value and/or correlation with cloud tops identified in the atmosphere products. The severity of atmospheric forward scattering, causing broadening of the waveform and a derived elevation that is too low, is a function of cloud optical depth, height, vertical extent, and particle size. The possible presence of atmospheric forward scattering per laser shot is indicated by measures of 1064 nm integrated atmospheric backscatter and cloud height available in GLA06 and GLA12-15 at 40 Hz beginning with Release 24. Model-based forward scattering range correction estimate of TBD accuracy for the L2a and L2b operation periods based on the 532 nm channel atmospheric products is available in GLA06and GLA12-15 at 1 Hz beginning with Release 18. Model-based forward scattering range correction for all laser operations periods based on 1064 nm channel atmospheric products may be available in a future release. Waveform saturation and atmospheric forward scattering elevation errors, each which can be at the cm to m level, can be coupled and offsetting. Increased cloud cover reduces saturation range error but can increase forward scattering range error. 7) ICESat 1-Hz normal points were created for comparison to TOPEX and the MSS. All three rows show averages of daily means (so stdev is the daily variation). Details will be in GRL article 2005GL024306. For reference, TOPEX RMS is typically ~12 cm,A-D bias ~0 ± 2 cm. Laser Far-field Patterns * Data currently available through NSIDC. Satellite Orientation The ICESat/GLAS spacecraft operates in two attitude modes depending on the angular distance between the orbit plane and the Sun (β′ angle). As shown in Figure 1, for low-β′ periods, such as that immediately followinglaunch, the so-called “airplane-mode” is in use, with the solar panelsperpendicular to the orbit plane.When the β′ angle exceeds 32degrees, however a yawmaneuver places the satellite inthe "sailboat-mode", with the axis of solar panels now in theorbit plane. Sample images of the within-footprint spatial distribution of laser energy measured by the GLAS Laser Reference Sensor during different campaigns. Laser 1 (2/20/03) Laser 1 (3/4/03) Laser 1 (3/26/03) Laser 2a (9/26/03) Courtesy of: H.J. Rim, B.E. Schutz CSR,University of Texas, Austin Laser 2b (2/18/04) Laser 2c (5/18/04) Laser 3a (10/4/04) Laser 3b (2/18/05)