Download
1 / 37
400 likes | 592 Views
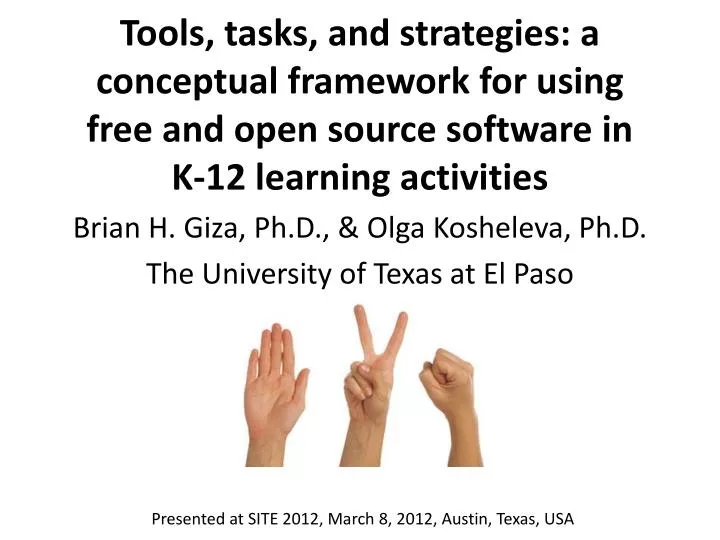
Tools, tasks, and strategies: a conceptual framework for using free and open source software in K-12 learning activities. Brian H. Giza, Ph.D., & Olga Kosheleva , Ph.D. The University of Texas at El Paso. Presented at SITE 2012, March 8, 2012, Austin, Texas, USA.

E N D
Tools, tasks, and strategies: a conceptual framework for using free and open source software in K-12 learning activities Brian H. Giza, Ph.D., & Olga Kosheleva, Ph.D. The University of Texas at El Paso Presented at SITE 2012, March 8, 2012, Austin, Texas, USA
Tools, Tasks and Strategies (1) • The Tool, Task and Strategies (TTS) Framework is a method for re-examining lessons ('tasks") in light of changing tools in order to utilize effective teaching strategies (pedagogies). TTS is a way of looking at how technology and lessons fit together and can assist a teacher in tool-transference, adapting a new tool to a task and updating related learning strategies to the use of a new tool.
Tasks and task analysis • The TTS framework is derived partially from the concept of technology task analysis. Task Analysis is well known in training and industrial design. It has a venerable tradition in classrooms, going back to work done by the US Department of Defense in breaking down the steps required to master skills as diverse as operating a can opener or in driving a tank.
Tasks and task analysis (2) • There are two general camps in task analysis: Cognitive task analysis which looks at what is going on in the brain of an individual as they consider and order the steps required to do a task (Kiera & Meyer, 2000) and Human performance task analysis, which looks at the procedures an individual actually performs in accomplishing a task (Dix, et al., 2004).
Task Analysis (3) • In simplistic terms Cognitive task analysis can be summarized as studying what is going on in the mind of an individual as they perform a task. • In equally simplistic terms Human performance task analysis studies the behavioral aspects and physical steps of performing a task.
Task Analysis (4) • To the typical educator the term task is usually closely associated with a pedagogical task or objective - what is it that the educator wants the pupil to learn? • In the Tools, Tasks, and Strategies framework the term TASK has two meanings, depending on the context: (1) What is it that the pupil is to learn (the learning goal or objective) or (2) What are the steps or processes involved in learning something? (The actions that take place in learning).
Teacher tasks as objectives • Experienced teachers are pretty good at writing tasks. A typical learning objective that involves a tool in the lesson can be written this way: • "...using the X technology tool, students will be able to create an [artifact] that demonstrates their ability to...etc.".
Swapping tools in tasks • "...using a pencil & paper, students will be able to create an essay that demonstrates their ability to...etc.". • "...using Microsoft Word, students will be able to create an essay that demonstrates their ability to...etc.". • "...using a Wiki, students will be able to create an essay that demonstrates their ability to...etc.".
Tool-Task Dependence • Tool-task dependence is when a tool is usually used for only one task. It is sometimes the result of the “common knowledge” or expectations for the way a tool is used, and is sometimes the result of the limited TTS experiences of novice teachers. • Some tools are ‘tightly-dependent’ and some tools are ‘loosely-dependent’
A loosely task-dependent tool (PowerPoint) • PowerPoint can be used for presentations. • PowerPoint can be used as a graphics program, creating handouts or layered text-and-graphics wall displays for classrooms. • PowerPoint can be used by a person organizing ideas (slide-sorting index cards) • PowerPoint can store digital media, allowing it to be used as a digital portfolio. • Etc., etc., etc.
Tool-Task Dependence and Tool Task Independence are also teacher attitudes • Sometimes teachers trained in the use of a particular technology tool to accomplish a particular learning task using a strategy (pedagogy) they understand are often reluctant to vary the tool, or the strategy to accomplish the same task.
Tool Task-Dependence can lead to orphan technologies • The LaserDisk Player • The Apple QuickTake camera • The floppy disk • The phonograph record • And someday… • The Amazon Kindle?
Strategies: Technology tasks are often found in lessons in which students perform at lower cognitive levels • Sadly, more often than not, technology has been employed to reinforce basic knowledge and skills at the lower cognitive levels. This has been a problem for many years and in many countries. Passey (1999, p 243) noted that evaluations of the National ICT Curriculum in the United Kingdom had the vast majority of the learning objectives at the Bloom's knowledge acquisition or comprehension level (27 items) versus higher cognitive levels (Synthesis and evaluation: 5 items).
New Tools can provide ways to reinvent tasks • At UTEP our technology education program works almost exclusively with Free and Open Source Software (FLOSS). Usually we use portable (USB drive-based) versions that we can give away for free, and that can be carried home or to various labs by our students, allowing them to easily familiarize themselves with them. • Instead of Adobe PhotoShop our program uses the free and open source Gnu Image Manipulation Program (GIMP) for teaching graphics editing and some forms of animation.
GIMP and mathematics learning • At UTEP our experiments with tool task-independence has led us to developing ways to use the GIMP graphics program in mathematics education. • Drs. Giza and Kosheleva have been using the GIMP to help students explore a little-known but powerful way to calculate the interior size of complex polygons: An application of Pick’s Theorem using the GIMP.
Powerful graphics programs as tools in mathematics learning Exploring Tangrams in the GIMP
The GIMP Pick’s Theorem lesson • Available at http://www.educationtechnologies.com/modules/picks1/
How do one compute the area of a polygon when the shape is irregular? • What do you think children will do? Do you think knowing formula in this case will help? Let’s discover such formula.
Polygon 1 Polygon 2 Polygon 3 Let’s explore! • What is common in all these polygons? What did you notice?
Can you show on your geoboards another shape of the same type that has the same area? How many boundary points does it have?
Polygon 4 Polygon 5 Polygon 6 Let’s explore! • What is common in all these polygons? What did you notice? ______________________________________ ________________________________________________________ ________________________________________________________
Polygon 7 Polygon 8 Let’s explore! • What is common in all these polygons? Can you show on your geoboards another shape that has the same area? How many boundary points does it have?_________________________ Is there a relationship between area of a polygon and number of pegs? Can you describe it? (Pick’s theorem is: Area = B/2 + I – 1 ) _______________________________________________________________
Applying Pick’s theorem in the classroom using a real world example and a free graphics tool • Five E model • We shall be using an adaptation of the well-known Five-E learning cycle model in this tutorial (Bybee et al, 1989; Bybee et al, 2006). The Five Es are: Engage, Explore, Explain, Evaluate, and Extend. In this tutorial we shall emphasize the Explore and Explain components, combining them together as the Explore step-by-step activities. The Evaluation is simple: Can the user perform an oil spill area measurement using Pick's Theorem and a graphics program? Can we provide an answer to the key question relating the size of the oil spill as seen from space in early May 2010 to the size of Puerto Rico?
Engage: The Gulf Oil Spill of 2010 Framing the lesson: "On May 9, 2010, oil continued to flow from a damaged offshore oil well in the Gulf of Mexico. This image from the Moderate Resolution Imaging Spectroradiometer (MODIS) on NASA’s Aqua satellite shows the slick on Sunday afternoon." From the text accompanying the NASA earth Observatory Image of the Day at http://earthobservatory.nasa.gov/NaturalHazards/view.php?id=43917, caption by Rebecca Lindsey
Open the GIMP graphics program and load USA7_AMO_2010129.jpg. This is an edited version of the NASA Earth Observatory image of the 2010 Gulf oil spill. A 15 km scale bar has been added (circled in the image above this paragraph). This version of the image will be used for determining the answer to the question "What is the area of the oil spill?" To be sure that we are ‘all on the same page' for the purpose of this exercise we shall restrict the definition of oil spill surface area to the whitish-gray horseshoe-shaped area that is circled in the image above and ignore the ropy streams of oil around it.
To make it even easier to identify the perimeter of the spill we shall use the GIMP's Threshold function. Applying a 'Threshold' filter reduces all the colors down to only two (black and white, or more correctly, areas of color and no color). The user can adjust the limiting factors - using the slider to set the intensity or shade at which the program splits into either black or white. To keep things easier we shall accept the default threshold setting. The menu sequence is COLORS: Threshold
A suggestion on how to proceed when counting lots of points: Your author decided that it easier to create a layer with colored dots for the ones on the perimeter and an additional layer with different colored dots that he placed on every point that he deemed a point was in the interior...and then he summed up each of his colors of dots.
Evaluate: Using Pick's theorem, calculate the area of the oil spill in units. Count the perimeter and interior points and apply Pick's Theorem. How many interior points did you get? Divide this number by 2. How many perimeter points did you get? Add the number of perimeter points to the number of interior points divided by two. That is the number of units in square area. Using the scale bar on the image, and assuming that our grid points are 3 km apart, convert your units to square kilometers (Each grid square is 3 Km on a side). How many square km did you get? If we say that Puerto Rico is 9,000 square kilometers, is the oil spill over 10 % larger than that? over 10% smaller than that? About the same size? Much larger? Much smaller? discuss your answer with others in the workshop. What are some sources of error? The author came up with 46 pts on the perimeter and 141 pts inside. i + (b/2) - 1 141 + (46 ÷ 2) – 1 = 163
Tool-Task Independence • The Tool, Task, and Strategies Framework gives the educator more ways to explore some important concepts: (1) the use of technology in student-centered, inquiry-based ways with educational outcomes at higher order cognitive levels; and (2) the use of technology in novel ways that categorize tools by how they may be used to accomplish an inquiry-based instructional goal, rather than their traditional, role. It is this ability to re-examine a tool's use that frees up an educator's creativity, and promotes a kind of thinking about technology applications that the authors refer to as "tool-task independence". It is the task that is most important, not the tool.
Tool-Task Independence (2) • The ability to re-think tools to accomplish a learning tasks is only part of the puzzle. The desired pedagogy is particularly important. The TTS Framework simply provides more ways to think about pedagogical options because the number of tool-task options (ways to use different tools to accomplish the same task) is increased.
Tools come and go and a wise educator does not become too dependent on any one tool - instead they are better off understanding how a class of tools works so that they may transfer the learning tasks and learning strategies to new tools.
Questions? Comments Contact Dr. Brian H. Giza via email at bhgiza@utep.edu Contact Dr. Olga Kosheleva via email at olgak@utep.edu This presentation may be downloaded from http://www.educationtechnologies.com/modules/2012site The GMP – Pick’s lesson may be accessed at http://www.educationtechnologies.com/modules/picks1
References (1) • Anderson, L. W., Krathwohl, D. R., Airasian, P. W., Cruikshank, K. A., Mayer, R. E., Pintrich, P. R., & Wittrock, M. C. (Eds.). (2001). A taxonomy for learning, teaching, and assessing: A revision of Bloom’s taxonomy of educational objectives. Boston, MA: Pearson Education Group, Allyn & Bacon. • Bloom, B. S. (Ed.). Englehart, M. D., Furst, E. J., Hill, W. H., & Krathwohl, D. R. (1956). Taxonomy of educational objectives: The classification of educational goals, by a committee of college and university examiners. Handbook I: Cognitive domain. New York, NY: Longmans, Green. • Bohning, G., & Althouse, J. (1997). Using Tangrams to Teach Geometry to Young Children. Early Childhood Education Journal, 24(4), 239-242. • Daviddarling.com (n.d.). Pick's theorem. The Internet Encyclopedia of Science: Geometry Polygons. Daviddarling.com Available online at http://www.daviddarling.info/encyclopedia/P/Picks_theorem.html. Accessed July 9, 2010. • Dix, A., Finlay, J., Abowd, G., & Beale, R. (2004). Human-Computer Interaction, 3rd Ed. Upper Saddle River, New Jersey: Prentice-Hall.
References (2) • Kieras, D., & Meyer, D. (2000). The role of cognitive task analysis in the application of predictive models of human performance. Chapter 15 in Schraagen, J., Chipman, S., & Shalin, V. (Eds.), Cognitive Task Analysis. Lawrence Erlbaum Associates, Mahwah, NJ. • Giza, B. H. (2011). Science Technology and Young Children. Chapter in Blake, Winsor, & Allen (Eds) Technology and Young Children: Bridging the Communication-Generation Gap. IGI Global, Hershey, PA. 2011. • Giza, B. H., & Kosheleva, O. (2010). Proportional Reasoning, Pick's Theorem and an Open Source Graphics Tool. Kaleidoscope Conference, El Paso, Texas, March 5, 2011. Available at http://www.educationtechnologies.com/modules/picks1/. • Giza, B. H. (2010). Using open-source graphics, animation, and video tools in STEM education. Chapter In Maddux, Gibson, & Dodge. (Eds.) Research highlights in technology and teacher education 2010. pp. 243-250. Society for Information Technology & Teacher Education (SITE). Chesapeake, VA: AACE. Available http://www.editlib.org/p/35314. 2010. • Haigh, G. (1980). A 'Natural' Approach to Pick's Theorem. The Mathematical Gazette, Vol. 64, No. 429 (Oct., 1980), pp. 173-177.. • Kosheleva, O. (2009). Geometry and Algebra Make Good Bedfellows! Explorations of Area on Geoboards. Abstracts of the Annual Meeting of the National Council of Teachers of Mathematics NCTM'09, Washington, DC, April 22-25, 2009, p.125. • Lehnart, A., Simon, M., & Graziano, M. (2001). The Internet and Education: Findings of the Pew Internet & American Life Project. Pew Internet & American Life Project. Washington, DC.
References (3) • McLellan, H. (1992). Narrative and episodic story structure in interactive stories. East Lansing, MI: National Center for Research on Teacher Learning. (ERIC Document Reproduction Service No. ED 348 012). • Mott, M. S. & Klomes, J. M. (2001). The synthesis of writing workshop and hypermedia-authoring: grades 1-4. Early Childhood Research & Practice. Fall 2001,3(2). [On-line] Available: http://ecrp.uiuc.edu/v3n2/mott.html • OSI (2005). The Open Source Definition, Version 1.9. The Open Source Initiative, Inc. [On-line] Available: http://www.opensource.org/docs/definition.php. • Passey, D. (1999) Strategic Evaluation of the impact on learning of educational technology. Education and Information Technologies, 4(3) 223–250. • United States Department of Education (2010). Transforming American Education: Learning Powered by Technology. Draft National Educational Technology Plan 2010, Executive Summary, March 5, 2010. Office of Educational Technology, U.S. Department of Education. Available: http://www.ed.gov/sites/default/files/NETP-2010-exec-summary.pdf • Watson, D. (2001). Pedagogy before technology: Re-thinking the relationship between ICT and teaching. Education and Information Technologies 6(4), 251–266, Kluwer Academic Publishers. DOI: 10.1023/A:1012976702296