Download
1 / 51
510 likes | 636 Views
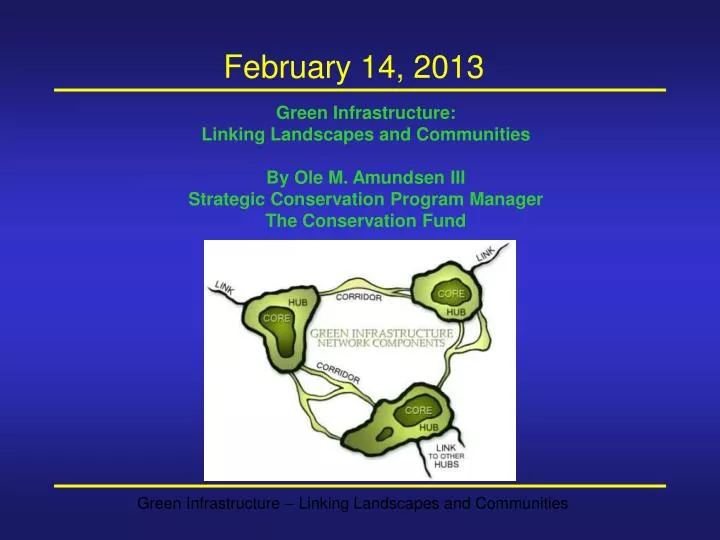
February 14, 2013. Green Infrastructure: Linking Landscapes and Communities By Ole M. Amundsen III Strategic Conservation Program Manager The Conservation Fund. The Conservation Fund Mission Statement.

E N D
February 14, 2013 Green Infrastructure:Linking Landscapes and CommunitiesBy Ole M. Amundsen III Strategic Conservation Program Manager The Conservation Fund
The Conservation FundMission Statement The Conservation Fund forges partnerships to conserve America’s legacy of land and water resources. Through land acquisition, community and economic development, and training and education, the Fund and its partners demonstrate balanced conservation solutions that emphasize the integration of economic and environmental goals
Strategic Conservation Services • Green Infrastructure Approach • Identify best lands to conserve and to accommodate development • Implement strategies for smarter, sustainable land uses IslandPress.org Greeninfrastructure.Net
Why “Infrastructure”? Infrastructure – “the substructure or underlying foundation on which the continuance and growth of a community depends” Webster’s New World Dictionary • Network connections are required for functioning infrastructure • Infrastructure features and processes need to be managed to maintain essential services • Funding for infrastructure needs to be provided up-front • Infrastructure is a necessity not an amenity
Green Infrastructure – What is it? • A strategically planned and managed network of natural lands, working landscapes, and other open spaces that conserves ecosystem values and functions and provides associated benefits to human populations
Green Infrastructure Network Design • Core Areas: • Contain fully functional natural ecosystems • Provide high-quality habitat for native plants and animals • Hubs: • Slightly fragmented aggregations of core areas, plus contiguous natural cover • Corridors: • Link core areas together • Allow animal movement and seed and pollen transfer between core areas 7
ID LANDSCAPE TYPES/GATHER AND PROCESS DATA SEEK “OUTSIDE” REVIEW & INPUT IDENTIFY & CONNECT NETWORK COMPONENTS (HUBS, LINKS & SITES) ASSESS NETWORK COMPONENTS / SET PRIORITIES FOR ACTION Green Infrastructure Steps Green Infrastructure Network Design DEVELOP DESIGN GOALS & OBJECTIVES/ SELECT DESIRED GI ATTRIBUTES
Step 1. Green Infrastructure Network Design DEVELOP DESIGN GOALS & OBJECTIVES/ SELECT DESIRED GI ATTRIBUTES
Central Indiana Land Trust GI Project • Conserve significant contiguous natural habitat • Identify and protect a network of stream and land corridors for wildlife movement and human enjoyment • Help local planning become more environmentally sensitive • Increase public awareness of the multiple benefits of green infrastructure • Increase public support for green infrastructure • Increase the coordination of green and gray infrastructure projects to maximize the benefits for nature and people
Resource Inventory, Analysis, and Synthesis Gathering information on current natural resource conservation and green space programs and policies at the federal, state, regional and local level
ID LANDSCAPE TYPES/GATHER AND PROCESS DATA Step 2. Green Infrastructure Network Design DEVELOP DESIGN GOALS & OBJECTIVES/ SELECT DESIRED GI ATTRIBUTES
Landscape Attributes Identifying the landscape attributes or features present in the study area provides direction as to the diversity of data you will need to collect for network design. Ecological Network Landscape Attribute Large blocks of undisturbed forest High-quality wetland complexes Minimally impaired stream reaches plus associated riparian vegetation, within minimally impacted watersheds • Landscape Type • Forest • Wetland • Freshwater aquatics
Identify Landscapes – Central Indiana In the Central Indiana there were several landscapes of interest including: • Forests • Freshwater aquatic • Wetlands
Identify Landscape Attributes – Central Indiana Features Include Trails Historic Resources Landcover Types Stream-River Corridors Lakes Floodplains Wetlands Rare, Threatened and Endangered Species
ID LANDSCAPE TYPES/GATHER AND PROCESS DATA IDENTIFY & CONNECT NETWORK COMPONENTS (HUBS, LINKS & SITES) Step 3. Green Infrastructure Network Design SELECT Desired GI ATTRIBUTES / DEVELOP DESIGN GOALS & OBJECTIVES
Better Worse Better Worse GI Network Design Guidelines • Species well distributed across their native range are less susceptible to extinction than species confined to small portions of their range. • Large blocks of habitat, containing large populations of a target species, are superior to small blocks of habitat containing small populations. • Blocks of habitat close together are better than blocks far apart. Cont’d…
Better Worse Better Worse GI Network Design Guidelines • Habitat in contiguous blocks is better than fragmented habitat. • Interconnected blocks of habitat are better than isolated blocks; corridors or linkages function better when habitat within them resembles that preferred by target species. • Blocks of habitat that are roadless or otherwise inaccessible to humans are better than roaded and accessible habitat blocks.
Central Indiana: Core Wetlands • King Rail (Rallus elegans) • Emergent wetlands/marshes • > 20 acres • Indiana Bat (Myotis sodalist) MaxEnt modeling • Climate data • Land use • Other layers
Maximum Entropy (MaxEnt) Models • MaxEnt is a machine learning technique that can be used to predict plant or animal distribution. • Compare species occurrences over a study area to a set of relevant environmental factors, such as vegetation or soil. • Estimates spatial distribution of the species by assuming nothing about which is unknown (maximizing entropy) but by matching the occurrence data with underlying environmental variables. • Useful for rare and endangered species since absence data is not required and the model needs relatively small number (50) occurrence points.
Indiana Bat MaxEnt Model • Indiana Bat Summer habitat preferences: • Forested habitat, near water, wetlands • Roosting sites under sloughing bark of large live or dead trees with direct sun exposure • Winter hibernacula (caves) could not be satisfactorily modeled, but most cave locations are known. Protecting known hibernacula and combating white-nose syndrome are the highest priority for this species. • For Indiana both the GAP data and National Land Cover Data were used and compared
Indiana Bat Model for the State of IN Model Inputs • Point locations of focal species: A total of 208 element occurrences (both individuals and colonies) were used for Indiana. • Grid (raster layers) representing relevant environmental factors: A total of 30 Environmental Variables were used for Indiana.
Hubs • Slightly fragmented aggregations of core areas, plus contiguous natural cover • Large enough to support populations of native species and serve as sources for emigration into surrounding landscape
How Big Are Hubs? It depends… Disturbance Example Forest - In 300 Years: • 15 Fires • 4 Hurricanes • 7 Windstorms • Infestations • Blight • Disturbances the Rule, Not the Exception Source Mark Anderson, TNC, LTA Rally 2004
How Large Are Forest Hubs? Source Mark Anderson, TNC, LTA Rally 2004
Corridors • Linear features linking core areas • Wind through human-dominated land like agriculture or development • Allow animal, seed, and pollen movement between core areas
How wide to make corridors? It depends… Studies on corridor width vary; best functioning corridors are wide enough for interior conditions and species (as shown at right) Narrow corridor with no interior conditions Narrow corridor with eroded stream banks and invasive plants
Forested Buffers for Streams • No rules of thumb, however, recent studies recommend a minimum buffer width of 115 feet of forested land cover to provide basic physical and chemical buffering. • For many eastern states, wildlife movement facilitated by buffers at 650 feet in fragmented areas to 1,100 feet (500 ft interior forests with 300 ft buffer on either side) in less fragmented areas. • Can consider reforestation in fragmented areas to achieve adequate widths for corridors.
Least Cost Path GIS Model • Calculates the least accumulative cost distance for each cell to the nearest source (e.g., between one core area and others) over a cost surface. • A series of “cost” or “impedance” layers are created. • The higher the cost, the more difficult it is for a species to move across the landscape • Model outputs are one cell width • (30 meter) paths • Paths are expanded to a minimum • size as required by focal species
Least Cost Path for Forest Corridors • Cost layer for forest is a composite of the following layers: • Land cover (degree of forested land) • Impervious surfaces • Roads (remoteness, fragmentation) • Focal species: • Bobcat, grey fox, turkey, and • eastern box turtle: • Corridor width set at 100 meters • (328 feet)
ID LANDSCAPE TYPES/GATHER AND PROCESS DATA IDENTIFY & CONNECT NETWORK COMPONENTS (HUBS, LINKS & SITES) ASSESS NETWORK COMPONENTS / SET PRIORITIES FOR ACTION Step 4. Green Infrastructure Network Design SELECT Desired GI ATTRIBUTES / DEVELOP DESIGN GOALS & OBJECTIVES
Characterizing a green infrastructure network • Resources may be too limited to protect an entire network in the short term, so usually need to prioritize efforts. • Different ways to characterize and prioritize network elements: • Overall ecological value • Development risk • Functional (hydrologic control, nutrient cycling, wildlife habitat, etc.) • Ecosystem services (water quality, groundwater recharge, flood protection, pollination, carbon sequestration, genetic bank, ecotourism, etc.) • Combination (e.g., value and risk)
ID LANDSCAPE TYPES/ GATHER AND PROCESS DATA SEEK “OUTSIDE” REVIEW & INPUT IDENTIFY & CONNECT NETWORK COMPONENTS (HUBS, LINKS & SITES) ASSESS NETWORK COMPONENTS / SET PRIORITIES FOR ACTION Step 5. Green Infrastructure Network Design SELECT Desired GI ATTRIBUTES / DEVELOP DESIGN GOALS & OBJECTIVES
Public Involvement • Over 80 stakeholders attended Leadership forums • 129 stakeholders attended one of four focus group meetings on the following topics: • Working Lands • People, Greenways and Wildlife Corridors • Forest Interiors • Water Quality and Quantity • Technical review team of 26 experts
GTC Network Plan • Land Purchase • Nature Preserve Quality • Public Access • Larger Conservation Area BLOSSOM HOLLOW
Working directly with planning staff to provide language for Comprehensive Plans and Zoning • Providing GIS Shape Files to Planning Depts. • Using the GTC Network shape file for critical lands in storm-water management plans From Fishers Stormwater Management Plan
Functional Connectivity • Functional connectivity describes the degree to which landscapes facilitate or impede the movement of organisms and processes. • Product of both landscape structure and the response of organisms and processes to this structure.
Terrestrial Movement Analysis tool • Identifies and prioritizes areas most important for wildlife movement. • Tool developed by Tool Developed by: John Norman -NRSC, CO. TCF Reviewers: Michael Schwartz ,Jazmin Varela Ted Weber • Randomly places simulated organisms • throughout suitable habitat in landscape. • Optimal pathways identified • between organism locations and • other suitable habitat
Terrestrial Movement Analysis tool • Runs multiple iterations • Random placement varies for each iteration, thus pathway locations vary as well • Outputs from iterations averaged to create final pathways
Terrestrial Movement Analysis tool • The movement potential integrates - • patch connectivity (pathways) • corridor cost, and • inter-corridor movement • Resulting in single value that ranges between 0 and 1 with one indicating the highest potential for movement.