Download
1 / 46
470 likes | 730 Views
Renewable Resources and Clean Energy. Their role in South Carolina’s Electric Generation Portfolio. What is a renewable resource?. An energy resource that is naturally replenished in a relatively short period of time. These include: Solar Energy Wind Energy Biomass Geothermal Energy

E N D
Renewable Resources and Clean Energy Their role in South Carolina’s Electric Generation Portfolio
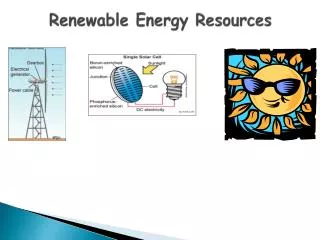
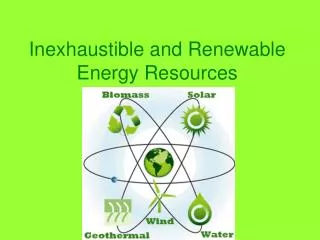
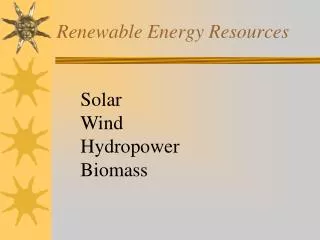
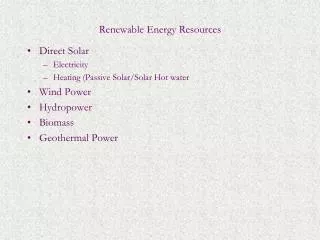
What is a renewable resource? • An energy resource that is naturally replenished in a relatively short period of time. • These include: • Solar Energy • Wind Energy • Biomass • Geothermal Energy • Hydropower
Why Renewable Resources? • Demand for electricity continues to increase • Fossil fuel-fired plants are responsible for: + • 67% of nation’s sulfur dioxide emissions • 23% of nitrogen oxide emissions • 40% of man-made carbon dioxide emissions • Technology is making fossil fuels cleaner but there is demand for lower emissions • Fossil fuel supplies are depleted faster than they can be generated +Source: U.S. Environmental Protection Agency (2007) http://www.epa.gov/cleanenergy/energy-and-you/affect/air-emissions.html
4 *Source: Energy Information Administration (2007 data) http://www.eia.doe.gov/emeu/aer/txt/ptb0802b.html +Source: ORS Energy Policy Report (2007 data) http://www.regulatorystaff.sc.gov/Energy%20Policy%20Report%20website.pdf
Actual Power Produced Power that would have been produced if plant operated at 100% all the time Capacity Factor = Capacity Factor A way to measure the productivity of power plants
Capacity Factor +Source: Energy Information Administration (2007 data) http://www.eia.doe.gov/cneaf/electricity/epa/epata6.html * Source: La Capra study (2007 data) http://www.energy.sc.gov/publications/Renewables%20Potential%20Final%20Report%20-09-12-2007-B.ppt
Solar Energy Converting the Sun’s energy into electricity 7
Advantages of Solar Energy+ • Air emissions are insignificant because no fuels are combusted • No sulfur dioxide emissions • No nitrogen oxide emissions • No carbon dioxide emissions • Photovoltaic (PV) systems do not require the use of water to generate electricity • Not affected by drought or limited water resources • No concern of environmental impact on rivers and lakes + Source: U.S. Environmental Protection Agency (2007) http://www.epa.gov/solar/energy-and-you/index.html
Advantages of Solar Energy+ • PV systems can be placed on existing structures, requiring no new land • Schools, office buildings, etc. can be utilized • The Sun’s energy is typically available during peak times • No ash or spent fuel created + Source: U.S. Environmental Protection Agency (2007) http://www.epa.gov/cleanenergy/energy-and-you/affect/non-hydro.html
Disadvantage of Solar Energy: Costs • Installed costs for utility-scale solar panels range from $4,000 to $5,000 per KW+ • Residential costs range from $8,000 to $10,000 per KW+ • Many recent projects are not disclosing their upfront costs • Silicone, a main component in panels, is expensive and in short supply • Estimates show cost of electricity ranging from 16.5 to 50 cents per kWh+ +Source: La Capra study (2007 data) http://www.energy.sc.gov/publications/Renewables%20Potential%20Final%20Report%20-09-12-2007-B.ppt
Geographic Limitations • To efficiently utilize solar power, panels must be located in an area with high solar radiation • South Carolina receives 4.5 – 5.5 kWh/meter2/day* • This varies during the winter • These levels are less than the recommended 6.75 kWh/meter2/day+ * Source: U.S. Department of Energy (2008) http://apps1.eere.energy.gov/states/alternatives/csp.cfm + Source: La Capra study (2007 data) http://www.energy.sc.gov/publications/Renewables%20Potential%20Final%20Report%20-09-12-2007-B.ppt
US Solar Potential Source: U.S. Department of Energy (2008) http://apps1.eere.energy.gov/states/alternatives/csp.cfm 12
Availability of Power • Sunlight is not constant • Must have supplemental system for evening usage • Capacity Factor: 19% – 21%+ • Weather conditions impact power • Less solar radiation in the winter • Cloudy, overcast days and fog • Potential damage to panels from storms • Dust, pollen, and debris can interfere with panels • Cleaning may be necessary +Source: La Capra study (2007 data) http://www.energy.sc.gov/publications/Renewables%20Potential%20Final%20Report%20-09-12-2007-B.ppt
Land Usage Considerations • If panels are not placed on existing structures, land use must be considered • Land required is difficult to determine because of variances in solar panel sizes and location • The largest solar facility located in California’s Mojave Desert occupies more than 1,500 acres+ +Source: NextEra Energy Resources www.nexteraenergyresources.com
Solar Electric Generating Systems California’s Mojave Desert • 354 MW capacity • Nine solar plants • 900,000 mirrors • 1,550 acres • Includes natural gas “back-up” • Location receives more than 7 kWh/meter2/day Solar Electric Generating Systems IV 15 Source: NextEra Energy Resources www.nexteraenergyresources.com
How large is 1,550 acres? • Riverbanks Zoo: 170 acres • University of South Carolina campus:384 acres • Central Park: 843 acres • Sesqui State Park:1,440 acres • 1,550 acres = 1,174football fields Half of Central Park’s 843 acres 16
Wind Energy Converting the Earth’s wind into electricity 17
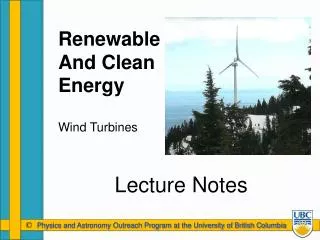
Advantages of Wind Power+ • Air emissions are insignificant because no fuels are combusted • No sulfur dioxide emissions • No nitrogen oxide emissions • No carbon dioxide emissions • Wind turbines do not require the use of water to generate electricity • Not affected by drought or limited water resources • No concern of environmental impact on rivers and lakes • Minimal water may be needed to clean blades if there is not sufficient rainfall + Source: U.S. Environmental Protection Agency (2007) http://www.epa.gov/cleanenergy/energy-and-you/affect/non-hydro.html
Advantages of Wind Power+ • Supplies are unlimited when the wind blows • No ash or spent fuel created • When turbines are removed from land, there are no solid wastes or fuel residues left behind + Source:U.S. Environmental Protection Agency (2007) http://www.epa.gov/cleanenergy/energy-and-you/affect/non-hydro.html
Disadvantage of Wind Power: Costs • Average installed costs of onshore wind power: $1,800 to $2,000 per KW + • Average installed costs of offshore wind power: $2,800 to $3,300 per KW + • Costs of producing energy vary based on location • Estimated cost of electricity ranges from 12 to 15.5 cents per kWh+ + Source: La Capra study (2007 data) http://www.energy.sc.gov/publications/Renewables%20Potential%20Final%20Report%20-09-12-2007-B.ppt
Geographic Limitations • Grid-connected turbines are typically rated for wind speeds of 14 meters per second (31 mph) + • South Carolina does not have sufficient on-shore wind speeds to support this form of energy • Mean Annual wind speed: • 70 meters (230 ft): 6.5 – 7.0 m/s (14.5 – 15.7 mph)* • Some offshore wind power might be available + Source: GE Energy (2005) http://www.gepower.com/prod_serv/products/wind_turbines/en/36mw/36mw_specs.htm * Source: S.C. Energy Office (2003) http://www.energy.sc.gov/publications/SC_spd70m_8April2005.pdf
22 22 * Source: U.S. Department of Energy (2009) http://www.windpoweringamerica.gov/wind_maps.asp
Offshore Limitations+ • Underwater transmission lines are very costly so project within 10 miles of the shore would be ideal • The northern part of SC has some potential for offshore projects • Offshore permitting is more complicated in federal waters (>3 miles offshore) • Potential damage from hurricanes • GE Wind: Turbines can sustain up to 130 mph winds (Category 3 hurricane) • S.C., N.C., and Georgia experienced 21 Category 3 hurricanes or greater since 1851. + Source: La Capra study (2007 data) http://www.energy.sc.gov/publications/Renewables%20Potential%20Final%20Report%20-09-12-2007-B.ppt
Availability Limitations • Wind is intermittent meaning it does not constantly blow • Must have backup for non-windy times • Capacity Factor: 25% – 35%+ • Wind is not dispatchable, meaning it can not be turned on or off based on demand + Source: La Capra study (2007 data) http://www.energy.sc.gov/publications/Renewables%20Potential%20Final%20Report%20-09-12-2007-B.ppt
Wind Turbine Sizes • GE 3.6 MW Model + • Blades: approx 160 ft each (half of a • football field) • Tower: 295 ft • Total Height: 455 ft (38 stories – • Columbia’s Capital Center: 25 stories) • Vertical Airspace: 364 ft • Weight: 164 Tons (69 Ford F-150 trucks or 112 Toyota Prius cars) • Platform: • 1,000 tons cement/steel rebar • 30-50 feet across • 6-30 feet deep 25 + Source: GE Energy (2005) http://www.gepower.com/prod_serv/products/wind_turbines/en/36mw/36mw_specs.htm
Cape Wind Nantucket Sound, MA • Proposed Project: • Capacity: 420 MW • Acres: 16,000 (Larger • than Myrtle Beach, SC) • Wind Turbines: 130 • Cost: Undisclosed • 34 acres per MW 26 + Source: Cape Wind (2009) www.capewind.org
Biomass: Landfill Gas Landfills contain methane which can be captured and combusted for energy 27
Landfill Gas (LFG) Advantages: • Methane is captured to produce electricity • Prevents the emission of methane, a greenhouse gas which is a harmful GHG that is prevalent in landfills • Capacity factor is 80 – 85% which is higher than other renewable resources+ + Source: La Capra study (2007 data) http://www.energy.sc.gov/publications/Renewables%20Potential%20Final%20Report%20-09-12-2007-B.ppt
Landfill Gas (LFG) • Resources are limited – there are only so many landfills able to provide this power • Btu Content: 9,500 • Costs: 5.9 - 9 cents per kWh+ Current Projects: • Ten LFG projects are online in SC – more planned* • Almost 70% of BMW’s paint shop energy consumption is generated from LFG* * Source: U.S. Environmental Protection Agency (2009) http://www.epa.gov/landfill/proj/prof/profile/bmwmanufacturinglandfillg.htm + Source: La Capra study (2007 data) http://www.energy.sc.gov/publications/Renewables%20Potential%20Final%20Report%20-09-12-2007-B.ppt
Existing and Potential Landfill Gas to Energy Sites • 1 • Existing LGTE Projects • Palmetto (BMW) • Enoree • 2 • Anderson • Lee • Wellford • Union County Regional • Northeast Landfill • Georgetown County • Oakridge* • Berkeley County* • Bees Ferry Road • Hickory Hill* • Greenwood • (4/1/09) • Richland • 3 • Horry • Langley • 4 • Three Rivers • 5 • 6 • 7 • 8 * Under development or proposed for development 30 Source: U.S. Environmental Protection Agency (2009 data) http://www.epa.gov/lmop/proj/index.htm Source: La Capra study (2007 data) http://www.energy.sc.gov/publications/Renewables%20Potential%20Final%20Report%20-09-12-2007-B.ppt
Biomass: Wood and Wood Waste Burning wood and wood waste to create power 31
Wood and Wood Waste+ • Wood waste, logging residue and commercial thinning can be used in: • Direct fire generation (Biomass burned to produce steam to drive turbine engine) • Co-Fired Generation (Biomass mixed with fossil fuels, such as coal, to generate power) • Emissions (CO2) exist but carbon footprint is reduced • Reliability is greater than solar or wind • Capacity Factor: 70% – 75% + Source: La Capra study (2007 data) http://www.energy.sc.gov/publications/Renewables%20Potential%20Final%20Report%20-09-12-2007-B.ppt
Wood and Wood Waste+ Considerations: • Limited by the availability of fuel • Long-distance transportation not ideal • Btu content: 12,000 • Costs are approximately 9 to 13.5 cents per kWh + Source: La Capra study (2007 data) http://www.energy.sc.gov/publications/Renewables%20Potential%20Final%20Report%20-09-12-2007-B.ppt
Poultry Litter & Swine Waste+ Historically used as fertilizer but there are concerns about groundwater contamination Advantages: • Waste is combusted with no new carbon emissions • Reliability is much greater than solar or wind • Capacity Factor: 70% – 85% • Assists farmers in eliminating waste • Ash can be used as fertilizer • Btu content: 12,000 – 14,000 + Source: La Capra study (2007 data) http://www.energy.sc.gov/publications/Renewables%20Potential%20Final%20Report%20-09-12-2007-B.ppt
Poultry Litter & Swine Waste+ Considerations: • Limited by the availability of fuel and cost • Poultry Litter is more prevalent in South Carolina • Swine Waste is limited and requires greater transportation • Most likely use is co-firing due to limited resources • Costs are approximately 9 to 13.5 cents per kWh + Source: La Capra study (2007 data) http://www.energy.sc.gov/publications/Renewables%20Potential%20Final%20Report%20-09-12-2007-B.ppt
Geothermal Energy Converting the Earth’s heat into energy
Geothermal Potential Electric Direct Heat Geo. Heat Pumps Source: U.S. Department of Energy (2008) http://www1.eere.energy.gov/tribalenergy/guide/geothermal_resources.html
Hydroelectric Energy Converting the movement of the Earth’s water into energy
What is Clean Energy Electricity that when generated, does not produce pollution+ • This includes: • Renewables • Nuclear +Source: Stirling Energy http://www.stirlingenergy.com/news-media/glossary.asp
Nuclear Energy • Advantages: • Does not produce air pollution • Low fuel and operating costs • High capacity factor – 92% • Disadvantages • Water is required for electricity production • Spent Fuel • On-site Storage • Off-site Storage • High capital costs +Source: Energy Information Administration (2007 data) http://www.eia.doe.gov/cneaf/electricity/epa/epata6.html
Nuclear Energy+ • 104 reactors in the US • South Carolina: 3rd in US for nuclear energy • 7 Reactors in SC • Catawba 1 & 2 – 6 miles from Rock Hill, SC • Oconee 1, 2 & 3 – 30 miles west of Greenville • Robinson 2 – 26 miles from Florence • V.C. Summer – Jenkinsville – 26 miles from Columbia +Source: Nuclear Regulatory Commission (2008) http://www.nrc.gov/reactors/operating/map-power-reactors.html
U.S. Commercial Nuclear Power Reactors Years in Commercial Operation 0-9 10-19 20-29 30-39 +Source: Nuclear Regulatory Commission (2008) http://www.nrc.gov/reactors/operating/map-power-reactors.html
Conclusions • While renewable resources are a part of the solution, they are not the solution • Solar and wind are not economically feasible in South Carolina at this time • Biomass is an option for South Carolina • Geothermal and new hydroelectric are not available for utility-scale generation • Nuclear is an appropriate part of the generation mix for a GHG-constrained society