Download
1 / 10
100 likes | 115 Views
Create your own academic rigor dashboard using PowerPoint slides to assess and monitor school-wide practices effectively. Customize gauges, scores, and goals to track progress in various academic areas.

E N D
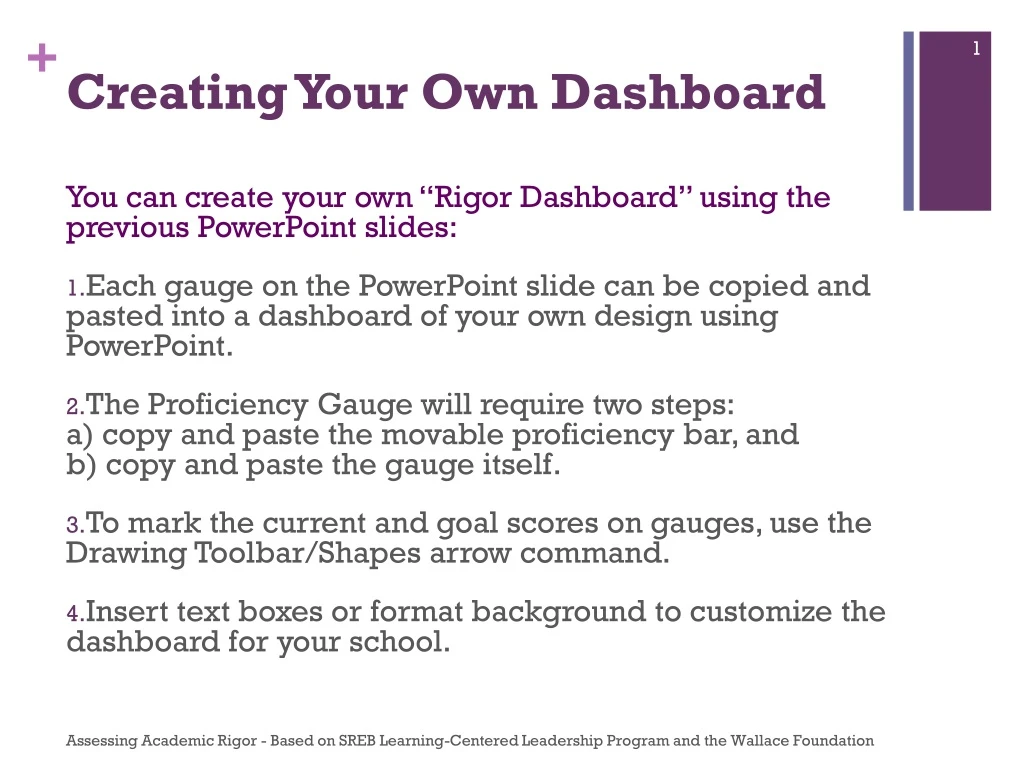
Creating Your Own Dashboard You can create your own “Rigor Dashboard” using the previous PowerPoint slides: • Each gauge on the PowerPoint slide can be copied and pasted into a dashboard of your own design using PowerPoint. • The Proficiency Gauge will require two steps: a) copy and paste the movable proficiency bar, and b) copy and paste the gauge itself. • To mark the current and goal scores on gauges, use the Drawing Toolbar/Shapes arrow command. • Insert text boxes or format background to customize the dashboard for your school. Assessing Academic Rigor - Based on SREB Learning-Centered Leadership Program and the Wallace Foundation
10 10 10 10 10 10 10 10 20 20 20 20 20 20 20 20 100% Expectations for Student Work Collaboration StudentSupport Instructional Strategies Assessment for Learning Grading Practices Course-taking/Grouping Curriculum Coherence 0 0 0 0 0 0 0 0 30 30 30 30 30 30 30 30 Not Ready Not Ready Not Ready Not Ready Not Ready Not Ready Not Ready Not Ready Schoolwide Schoolwide Schoolwide Schoolwide Schoolwide Schoolwide Schoolwide Schoolwide 75% 50% 25% Rigor Dashboard Gauges Proficiency Level Assessing Academic Rigor - Based on SREB Learning-Centered Leadership Program and the Wallace Foundation
Scoring Example Curriculum Coherence Not Ready School-wide 20 10 30 0 • 0 = No implementation • 10 = Getting Ready for Implementation • 20 = Emerging Implementation • 30 = School-wide Implementation
8th Grade ELA – An Example • Assessment in the Classroom = 26 • Collaboration =16 • Course-taking/Grouping =12 • Curriculum Coherence = 20 • Expectations for Student Work = 20 • Grading Practices =16 • Instructional Strategies = 20 • Student Support = 20 The school then plotted these scores on the “Dashboard” as a data display — to monitor school-wide practices. Assessing Academic Rigor - Based on SREB Learning-Centered Leadership Program and the Wallace Foundation
10 10 10 10 10 10 10 10 10 10 20 20 20 20 20 20 20 20 20 20 Assessment for Learning Grading Practices Grading Practices Curriculum Coherence Collaboration StudentSupport Curriculum Coherence Coursetaking/Grouping Instructional Strategies Expectations for Student Work 0 0 0 0 0 0 0 0 0 0 30 30 30 30 30 30 30 30 30 30 Not Ready Not Ready Not Ready Not Ready Not Ready Not Ready Not Ready Not Ready Not Ready Not Ready Schoolwide Schoolwide Schoolwide Schoolwide Schoolwide Schoolwide Schoolwide Schoolwide Schoolwide Schoolwide Rigor Dashboard Gauges for Example(Red arrow indicates current status) 0 = Not Ready 10 = Getting Ready for Implementation 20 = Emerging Implementation 30 = School-wide Implementation Assessing Academic Rigor - Based on SREB Learning-Centered Leadership Program and the Wallace Foundation
10 10 10 10 10 20 20 20 20 20 Coursetaking/Grouping Coursetaking/Grouping Grading Practices Coursetaking/Grouping Collaboration 0 0 0 0 0 30 30 30 30 30 Not Ready Not Ready Not Ready Not Ready Not Ready Schoolwide Schoolwide Schoolwide Schoolwide Schoolwide Rigor Improvement Strategies Current status: red arrow Goal status: green arrow Assessing Academic Rigor - Based on SREB Learning-Centered Leadership Program and the Wallace Foundation
Example Proficiency Gauge Proficiency Levels for Grade 8 English/Language Arts 100% 75% Grade 8 Reading – 72% were proficient Proficiency Level Grade 8 Writing – 53% were proficient Proficiency Level 50% 25%
Example Proficiency Gauge Proficiency Levels by Grade Levels and Subject Areas 100% 75% Grade 10 English/Language Arts – 72% were proficient Proficiency Level Grade 10 Math – 53% were proficient Proficiency Level 50% Algebra I – 42% were proficient Proficiency Level American History – 30% were proficient Proficiency Level 25%
10 10 10 20 20 20 Collaboration Coursetaking/Grouping Grading Practices 0 0 0 30 30 30 Not Ready Not Ready Not Ready Schoolwide Schoolwide Schoolwide Example: Multiple Gauges 100% Grade 10 ELA – 72% 75% Proficiency Level Grade 10 Math – 53% Proficiency Level 50% Algebra I – 42% Proficiency Level Amer Hist – 30% Proficiency Level 25% Assessing Academic Rigor - Based on SREB Learning-Centered Leadership Program and the Wallace Foundation
10 10 10 20 20 20 100% GradingPractices Coursetaking/Grouping Collaboration 0 0 0 30 30 30 Not Ready Not Ready Not Ready Schoolwide Schoolwide Schoolwide 75% Proficiency Level Proficiency Level 50% Proficiency Level Proficiency Level 25% Dashboard Example (with Narrative) • Our definition of rigor: • Rigor is . . . • Our strategies to increase rigor school-wide: • Collaboration: We will ... • Instructional Strategies: We will ... • Grading Practices: We will ... • Where we are now (date) and where we want to be by (date): Grade 6 Reading – 72% Grade 8 Reading – 53% Grade 6 Math – 42% Grade 8 Math – 30% Assessing Academic Rigor - Based on SREB Learning-Centered Leadership Program and the Wallace Foundation