Download
1 / 10
100 likes | 112 Views
This article explores the use of SeaWiFS data in human-environment research and indicator development, highlighting the integration of social and Earth science data and the accessibility of data to wider user communities. It also discusses the development of national-level indicators of coastal eutrophication and the mapping of chlorophyll-a concentrations.

E N D
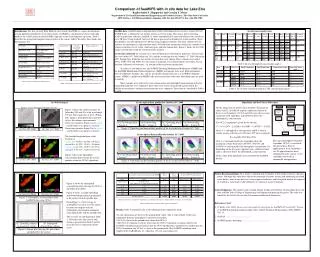
Alex de Sherbinin Sr. Research Associate, CIESIN Deputy Manager, Socioeconomic Data and Applications Center (SEDAC) Center for International Earth Science Information NetworkThe Earth Institute, Columbia UniversityPalisades, New York, USA e-mail: adesherbinin@ciesin.columbia.edu Use of SeaWiFS data in human-environment research and for indicator development
Socioeconomic Data & Applications Center (SEDAC) • Focus on human dimensions of environmental change • Integration of social and Earth science data, especially with remote sensing • Direct support to scientists, applied and operational users, decision makers, and policy communities • Strong links to geospatial data community
Motivation for working with SeaWiFS data • Convert data to GIS formats for integration with socioeconomic or “human dimensions” data • Making data more accessible to wider community of users • Understand how land-based human activities impact coastal eutrophication • Develop national-level indicators of coastal eutrophication Kg N / km2
Using SeaWiFS for indicator development • Convert annual composites in HDF to ArcMap GRID format • Buffer the coastline to 10km • Clip the SeaWiFS data based on EEZ from 10km out to 100km • Map chlorophyll-a concentrations • Assess significant trends in chlorophyll-a concentrations by grid cell
CIESIN work on indicators • Partner with Yale Center for Environmental Law and Policy, World Economic Forum, and EC’s Joint Research Centre on the Environmental Sustainability Index (ESI ‘00, ‘01, ‘02, ‘05) and Environmental Performance Index (EPI ‘06, ‘08) • Purpose is to compare country performance across a range of environmental issues – air quality, biodiversity conservation, energy, resource management – in order to: • Learn more about sources of success and failure • Clarify nature of policy challenges • Encourage healthy competition • Summarize complexity for multiple audiences • Now working at sub-national levels: Abu Dhabi and China
Example 2008 EPI Framework Fisheries Performance For fisheries indicators, expert advice provided by Jackie Alder of the University of British Columbia Fisheries Centre
Abu Dhabi EPI • We took the average annual concen-trations for the entire coastal zone, then measured the time series over 10 years Percent Change in Chlorophyll-a Concentration Abu Dhabi, UAE, 1998-2007 (black means no significant change)
China EPI • Concentrations are more than double global averages and those off the coast of Abu Dhabi
Next Steps • Will refine the approach for the China EPI • NASA ROSES project “Using Satellite Data to Develop Environmental Indicators: An Application of NASA Data Products to Support High Level Decisions for National and International Environmental Protection” • Advisors include Ajit Subramaniam (Lamont/NSF), Gene Feldman (NASA-GSFC), and Richard Stumpf (NOAA, Coastal Oceanographic Assessment, Status and Trends Branch) • Compare notes/results with Sybil Seitzinger and the Global Nutrient Export from Watersheds (NEWS) workgroup