Download
1 / 13
130 likes | 243 Views
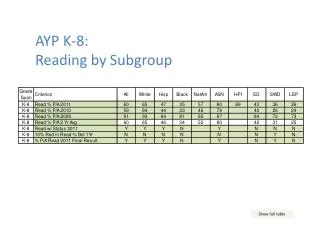
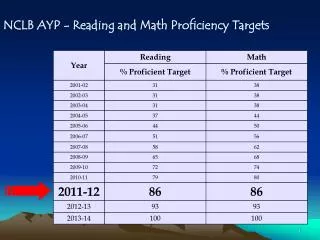
Reading and Interpreting the AYP Status Report. No Child Left Behind and AYP. 95 %. 0.0 or above. HS or schools with Grade 12: 90 % GR or improvement Grades 3 - 8: 95% attendance rate. By the number of subgroups. 5. 4. 5. 4. 1. School Improvement. Goals over time

E N D
95 % 0.0 or above HS or schools with Grade 12: 90 % GR or improvement Grades 3 - 8: 95% attendance rate
5 4 5 4 1
School Improvement • Goals over time • School performance this year and prior years • Two consecutive years in the same component
“Two and Two” SI 2 SI 1 No AYP SI 1 D Made AYP Not in SI
Reading No AYP Reading SI Year 1 Reading SI Year 2 Mathematics No AYP Mathematics SI Year 1 Mathematics SI Year1D AAI No AYP AAI SI Year 1 AAI SI Year 2 AAI SI Year 3
There are 4 Ways to Make AYP • Meet proficiency • Confidence Interval (CI) • Uniform Averaging (UA) • Safe Harbor (SH)
Partial Credit • Students scoring in Levels III or IV are considered to be proficient and count as 1.0 toward proficiency. • Students scoring in Level II are considered to be partially proficient and count as 0.5 toward proficiency.
Need More Information? • Follow this path to get to the Interpretive Guide document: • www.alsde.edu • Sections • Student Assessment • Publications • Choose document and download • Follow this path to get to the Sanctions and Rewards document: • www.alsde.edu • Sections • Federal Programs • Publications • Choose document and download