Download
1 / 41
420 likes | 1.03k Views
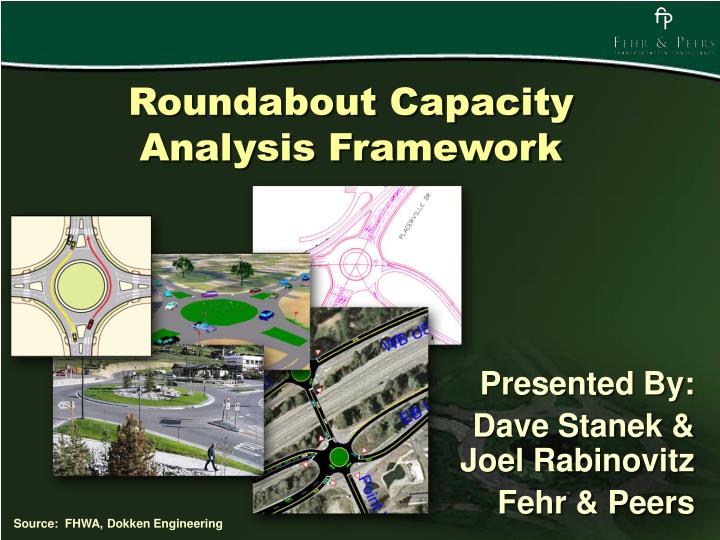
Roundabout Capacity Analysis Framework. Presented By: Dave Stanek & Joel Rabinovitz Fehr & Peers. Source: FHWA, Dokken Engineering. Presentation Overview. Roundabout Analysis Framework Roundabout Analysis Methods & Software Case Study #1 – SR 32 in Chico, CA

E N D
Roundabout Capacity Analysis Framework Presented By: Dave Stanek & Joel Rabinovitz Fehr & Peers Source: FHWA, Dokken Engineering
Presentation Overview • Roundabout Analysis Framework • Roundabout Analysis Methods & Software • Case Study #1 – SR 32 in Chico, CA • Case Study #2 – Kietzke Lane in Reno, NV
Analysis Framework • FHWA Guidelines • ADT volume thresholds • Peak hour entering vs. circulatory flow thresholds • Analysis Software • Conduct sensitivity testing • Understand methodology used
Simulation Checklist • When to Use • V/C ratios are > 0.85 • Corridor or system • Unique geometry (5-legs, adjacent signal, etc.) • Review LOS results • Review queuing results • Visually inspect simulation • Conduct sensitivity testing • NCRHP 572 gap acceptance
Analysis Methods • Macroscopic Models • For isolated locations • Analyze vehicle flows • HCM 2000, FHWA, NCHRP 572, RODEL, & SIDRA • Microscopic Models • For system analyses • Analyze individual vehicles & drivers • SimTraffic, Paramics, & VISSIM
HCM 2000 • Only one-lane roundabouts • LOS thresholds are undefined • Results are a range of v/c ratios • Use Synchro or HCS+ to calculate
FHWA • Roundabouts: An Informational Guide (FHWA, 2000) • Equations for delay and queue length • For one & two lane roundabouts with regular geometry (3 or 4 legs) • Recommends design to V/C of 0.85 • Use Traffix or formula
NCHRP 572 • NCHRP Report 572: Roundabouts in the United States (TRB, 2007) • Equations for delay and queue length • For one & two lane roundabouts with regular geometry (3 or 4 legs) • Based on U.S. data, but a limited sample size
RODEL • Barry Crown, UK • Regression equations based on observations of UK intersections • Design elements determine approach capacity (diameter, entry width, etc.) • Interactive design / operations analysis
RODEL • Limitations • Empirical data includes experimental observations • Uses equations calibrated to UK drivers and UK vehicles • Capacity is reached with small increases in volumes • Ignores circulatory or exit capacity • Ignores bypass lanes
SIDRA • Akcelik & Associates, Australia • Uses gap acceptance and lane utilization to determine capacity • Can change headway values to calibrate to local conditions – Environmental Factor • Limitations • LOS results not always consistent with predicted V/C or queues • Ignores bypass lanes
SimTraffic • Trafficware, USA • Stochastic simulation model • Uses Synchro for data input • Driver behavior and vehicle characteristics • Can change headway factors to calibrate to local conditions
Paramics • Quadstone, UK • Stochastic simulation model • Driver behavior and vehicle characteristics • Link/node network structure • Automatically creates roundabout • Lane change animation is unrealistic
VISSIM • PTV, Germany • Stochastic simulation model • 3D animation features • Link/connector network structure • Specify gap acceptance parameters by lane for each approach
Simulation Limitations • Too many parameters can be changed that affect results • Some view simulation as a methodology to “prove” a predetermined result • Many agencies/companies do not have the expertise to review simulation models
Review of Methods • FHWA & RODEL • Based on British regression equations • Gap acceptance & lane configuration are not addressed in the calculation • Very easy to use • SIDRA & SimTraffic • Allow calibration of gap acceptance parameters to local conditions • Easy to use • Paramics & VISSIM • Most flexible in modeling driver behavior • More difficult to use as there are more parameters affecting driver behavior
Case Study #1 – Chico, CA • Widening of SR 32 in Chico, CA • Two-lane rural highway with access control • Design Year (2030) PM Peak Hour • Project considered roundabouts at the 4 study intersections
Proposed Design Source: Mark Thomas & Co.
FHWA Guidelines • ADT on SR 32 & Bruce Rd at the limit • Daily volumes on SR 32 are above 40,000 vpd with high left-turn percentages • Peak-hour volumes exceed entry & circulatory volume capacity • Entry + circulatory flow ~ 2,500 vph • Both indicate that the roundabout should be at or over capacity
Review of RODEL Results • 20% increase in volume yields LOS F • RODEL manual does not identify the upper limit of the empirical data • RODEL does not account for right-turn delay even if vehicle queues block access to bypass lanes • RODEL does not consider the capacity of the circulatory roadway
Review of SIDRA Results 95th percentile queue is 883 feet V/C Ratios on all approaches exceed 0.85
Review of VISSIM Results Insufficient Circulatory Capacity Blocked Right-turn Bypass Lanes
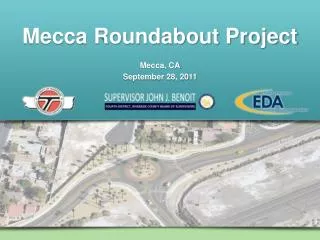
Case Study #2 – Reno, NV • Initial study performed using RODEL – Volumes were 40% lower, Result = LOS A • Asked by local agency to verify results • Comprehensive traffic analysis was performed using Vissim • Volumes analyzed represent 20-year horizon PM peak hour • Analysis compared signal and roundabout
Study Area Proposed Roundabout Location
Proposed Design Plan 2-lane section matches existing roadway configuration
Proposed Design Results Northbound vehicles will experience long queues and delay Southbound queue as long as existing queue with all-way-stop
Modified Design Plan SB Kietzke Ln 3-lane section allows both southbound lanes on Kietzke Ln to enter freeway Neil Rd Between Kietzke Ln and US 395 SB Ramps
Modified Design Results SB Neil Rd at Kietzke Ln NB Neil Rd at Kietzke Ln
Parting Thoughts • Similar to signalized intersection analysis, there is no “best” methodology • Methodology should be dependant on the situation • Concepts in the FHWA Simulation Guidelines & HCM also hold true in identifying whether roundabouts should be simulated
More Information • Roundabouts: An Informational Guide (FHWA, 2000) • New edition due in 2009 or 2010 • TRB National Roundabout Conference • 2005 (Vail, CO) • 2008 (Kansas City, MO) • ITE Conferences • DOT Guidance – CA, FL, NY, WI, etc.