Download
1 / 27
270 likes | 582 Views
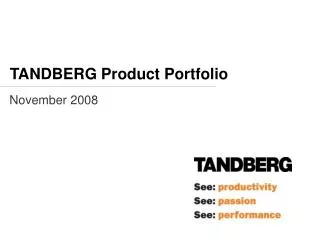
Product Family and Product Portfolio design. Product Portfolio A set of different products offered by a company at a given point of time. Product architecture A hierarchical, structural description of each product, Often based on functional decomposition. Product Portfolio Architecture

E N D
Product Family and Product Portfolio design Product Portfolio A set of different products offered by a company at a given point of time. Product architecture A hierarchical, structural description of each product, Often based on functional decomposition Product Portfolio Architecture Description of components/modules/systems of a set of products (past, present, future) offered by the company
Product Family and Product Portfolio design Different products do not share any components or modules [High sales volume]
Product Family and Product Portfolio design Products do not share components, Have adjustable input parameters
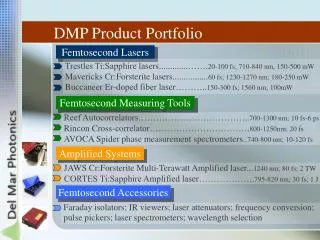
series of products that share some modules (software, hardware) Product Family and Product Portfolio design Images (c) Krups
Each subsequent model enhances only some subset of the modules of the previous generation (a) Canon® IXUS 700, Feb 05 (b) Canon® IXUS 750, Aug 05 Same CCD, Lens; Different LCD, controls Product Family and Product Portfolio design
Product Family and Product Portfolio design Architecture differentiates modules based on “module is consumable” or not Examples: Ink-cartridges for ink-jet printers film for film cameras, …
Nvidia GeForce PCX 5750 ATI Radeon X300 (LE) Product Family and Product Portfolio design Interface (mech, elec, software) follows a published standard Canon EF-lens mount system Bus-architecture in PC’s
MICRON 1GB DDR2 533MHZ DIMM MODULE MICRON 256MB DDR2 533MHZ DIMM MODULE Product Family and Product Portfolio design modules may be parametrically modified and fit into the product at the time they are ordered Examples: PC modules
Product Family and Product Portfolio design Product designed and made Based on customer-provided Engg spec Example: Tsing Ma Bridge
Product Family and Product Portfolio design Customer configures product by selecting a series of different modules that make up the product Dell PCs, Automobiles, Swatch, MyBarbie, NIKEiD, …
m1m2 … mkmpop s1s2 … skspop Designing Portfolios with multiple products 1. Statistical method: the customer-market model Interview customers identify reqts SURVEYS: Importance of each reqt Identify target values (m, s) for each reqt Identify time-variations of reqts Segregate customer-base into segments (factor analysis) Analyze specs for each segment for each requirement
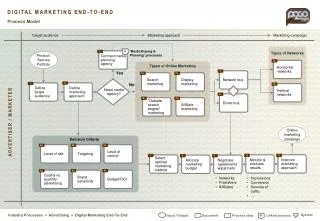
Designing Portfolios with multiple products 1. Statistical methods: demand assessments via customer surveys Possible decision tree m constant over time? N modular generations Y N spop is large ? fixed unshared portfolio Y segment s’s ≈ population s ? N modular families Y parametric/adjustable portfolio (e.g. car seats)
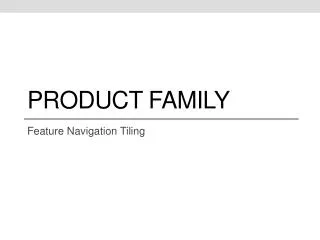
How to design Portfolios with multiple products 2. Functional Architecture: Break the product into functional modules power saw screwdriver scumbuster
How to design Portfolios with multiple products 2. Functional Architecture: Break the product into functional modules
How to design Portfolios with multiple products 3. Systematic Design Approach for size-ranging (Pahl and Beitz) Advantages of scaling: (a) The products are geometrically similar (b) We may use the same design drawings/models (change scale) (c) Manufacturing benefits: e.g. pantographs, tooling design Pahl and Beitz: Optimal schemes use geometric scaling
Systematic Design Approach for size-ranging.. Scaling and Non-dimensional techniques Length of a feature in the base design = L0, Length of the same feature in a different size of model = L1 Two products are geometrically similar if, for each feature, the ratio fL = L0 / L1 fL is non-dimensional
Systematic Design Approach for size-ranging.. Scaling and Non-dimensional techniques Step 1. Find the functional characteristic Step 2. Find a non-dimensional constant related to the characteristic Step 3. Define size steps for functional characteristic in geometric series Step 4. Scale all geometric features to maintain same non-dimensional constant value (functionality). heat dissipation = K ( surface area) scale factor fL area increases by fL2 increase in heat generation = K(fL) => heat sink may be scaled up by fL0.5 A simple heat sink
How to design Portfolios with multiple products 4. Taguchi’s Loss Function Men’s dress shirts: 10 sizes Each size: neck (collar length) and sleeve (arm length). neck sizes increments: 1 cm sleeve lengths increments: 2 cm. Person size ≠ nearest shirt size “Loss of Quality”
4. Taguchi’s Loss Function Men’s dress shirts Neck size = y Target = m If y ≠ m, there is a loss Loss = L(y) = L( m + (y-m)) Using Taylor-series expansion: L(m) + (y-m) L’(m)/ 1! + (y – m)2 L”(m)/ 2! + …
4. Taguchi’s method: Loss function.. Loss = L(y) = L( m + (y-m)) = L(m) + (y-m) L’(m)/ 1! + (y – m)2 L”(m)/ 2! + … Ideally: (a) L(m) = 0 [if actual size = target size, Loss = 0], and (b) When y = m, the loss is at its minimum, therefore L'(m) = 0 Taguchi’s Approximation: L(y) ≈ k( y – m)2
4. Taguchi’s Method: Loss Function… Assume tolerance limits : D1 and D2 neck size in range: [ m – D1, m + D2]. out-of-tolerance losses: D1 and D2 Assume over-size/under-size loss = $ 400 [out-of-limit] y < m, k1 = 400/ D12 y > m, k2 = 400/ D22. L(y) = k( y – m)2
4. Taguchi’s Method: Loss Function Example Let D1 = 0.5 cm, and D2 = 1 cm, k1 = 400/ 0.52 =1600, and k2 = 400/ 1.02 = 400, loss function : If a person has a neck size = 40.2, (i) Buy a size 40, => Loss of value = 1600 ( 40.2 – 40)2 = $64, Or (ii) Buy a size 41, => Loss of value = 400 ( 41 – 40.2)2 = $256.
4. Taguchi’s method: determination of size ranges Break even point for customers: 1600( y – 40)2 = 400 ( 41 – y)2 y* = 40.33 Net loss to community: If manufacturer offers only even sizes (40, 42, 44,…): Break even point: 1600( y – 40)2 = 400 ( 42 – y)2, or y* = 40.67 Net loss to community:
4. Taguchi’s method: determination of size ranges Break-even model: Compare total consumer loss with manufacturer benefit/order Estimate of manufacturer benefit: (retail price – production cost) Example: (retail price – production cost) = $180 Consumer loss on size ranges (40, 41, …) = $59.3 < $180 Consumer loss on size ranges (40, 42, …) = $237 > $180 Break even point: steps of 1.8cm
How to design Portfolios with multiple products 5. Systematic, Intuitive Methods 5.1. SCAMPER 5.2. Orthographic analysis Step 1. List independent attributes Step 2. Coordinate system, one axis per attribute Step 3. List values along each axis Step 4. Combine, Permute, Interpolate, Extrapolate
department stores fried potato chips Fry frozen vegetables frozen mashed potatoes department stores restaurants Orthographic analysis: Food Manufacturer Example current clients current products
Fry Orthographic analysis: Food Manufacturer Example Combine (processes): “fry” + “mash” hash-browns Combine (materials): potato + vegetable vegetarian patty Permute: fry vegetables vegetable chips Extrapolate: add fruits banana chips Interpolate: half cooked potato chips refry-to-eat