Download
1 / 18
180 likes | 236 Views
Explore a vivid fantasy of a grand weather forecasting factory where a conductor oversees computers working on global weather equations. From the pit to the gallery, computers calculate different regions, coordinated by officials. Adapting Richardson dividers to study border length, Richardson found that smaller units increased measurements infinitely, known as the Richardson effect. This method offers valuable insights for spatial analysis and forecasting methodologies.

E N D
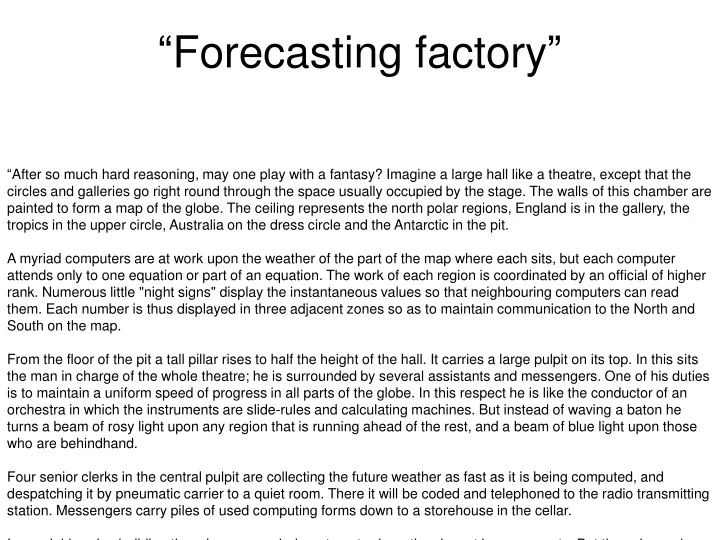
“Forecasting factory” “After so much hard reasoning, may one play with a fantasy? Imagine a large hall like a theatre, except that the circles and galleries go right round through the space usually occupied by the stage. The walls of this chamber are painted to form a map of the globe. The ceiling represents the north polar regions, England is in the gallery, the tropics in the upper circle, Australia on the dress circle and the Antarctic in the pit. A myriad computers are at work upon the weather of the part of the map where each sits, but each computer attends only to one equation or part of an equation. The work of each region is coordinated by an official of higher rank. Numerous little "night signs" display the instantaneous values so that neighbouring computers can read them. Each number is thus displayed in three adjacent zones so as to maintain communication to the North and South on the map. From the floor of the pit a tall pillar rises to half the height of the hall. It carries a large pulpit on its top. In this sits the man in charge of the whole theatre; he is surrounded by several assistants and messengers. One of his duties is to maintain a uniform speed of progress in all parts of the globe. In this respect he is like the conductor of an orchestra in which the instruments are slide-rules and calculating machines. But instead of waving a baton he turns a beam of rosy light upon any region that is running ahead of the rest, and a beam of blue light upon those who are behindhand. Four senior clerks in the central pulpit are collecting the future weather as fast as it is being computed, and despatching it by pneumatic carrier to a quiet room. There it will be coded and telephoned to the radio transmitting station. Messengers carry piles of used computing forms down to a storehouse in the cellar. In a neighbouring building there is a research department, where they invent improvements. But these is much experimenting on a small scale before any change is made in the complex routine of the computing theatre. In a basement an enthusiast is observing eddies in the liquid lining of a huge spinning bowl, but so far the arithmetic proves the better way. In another building are all the usual financial, correspondence and administrative offices. Outside are playing fields, houses, mountains and lakes, for it was thought that those who compute the weather should breathe of it freely.” (Richardson 1922)
Richardson dividers explained While studying the causes of war between two countries, Richardson decided to search for a relation between the probability of two countries going to war and the length of their common border. While collecting data, he realised that there was considerable variation in the various gazetted lengths of international borders. For example, that between Spain and Portugal was variously quoted as 987 or 1214 km while that between The Netherlands and Belgium as 380 or 449 km. As part of his research, Richardson investigated how the measured length of a border changes as the unit of measurement is changed. He published empirical statistics which led to a conjectured relationship. This research was quoted by mathematician Benoît Mandelbrot in his 1967 paper How Long Is the Coast of Britain? Suppose the coast of Britain is measured using a 200 km ruler, specifying that both ends of the ruler must touch the coast. Now cut the ruler in half and repeat the measurement, then repeat again: Notice that the smaller the ruler, the bigger the result. It might be supposed that these values would converge to a finite number representing the "true" length of the coastline. However, Richardson demonstrated that the measured length of coastlines and other natural features appears to increase without limit as the unit of measurement is made smaller. Today this is known as the Richardson effect.
Poem Weather prediction by Numerical Process 1922, p.66
Cascade schemata from Rose and Sulem 1978 Space filling Sparse/fractal