Download

1 / 81
860 likes | 1.16k Views
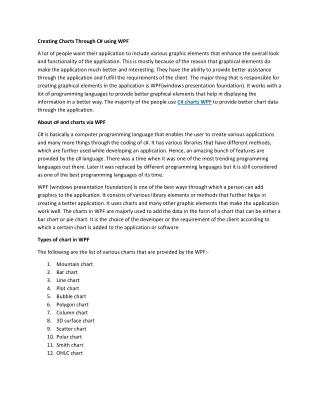
Creating Charts. Lesson 12. Microsoft Excel 2013. Objectives. Software Orientation. The INSERT tab contains the command groups you’ll use to create charts in Excel (below).

E N D
Creating Charts Lesson 12 MicrosoftExcel 2013 Microsoft Official Academic Course, Microsoft Word 2013
Objectives Microsoft Official Academic Course, Microsoft Word 2013
Software Orientation • The INSERT tab contains the command groups you’ll use to create charts in Excel (below). • To create a basic chart in Excel that you can modify and format later, start by entering the data for the chart on a worksheet. Then select that data and choose a chart type to graphically display the data. • By choosing a chart type, a chart layout, and a chart style—all of which are within easy reach on the ribbon’s INSERT and CHART TOOLS tabs—you will have instant professional results every time you create a chart. Microsoft Official Academic Course, Microsoft Word 2013
Step by Step: Select Data to Include in a Chart • GET READY. LAUNCH Excel. • OPEN the 12 4thCoffee Financial History file for this lesson. • Select B2:B8 (the 2010 data). • Click the INSERT tab, and in the Charts group, click the Pie button. Click the first 2-D Pie chart. A color-coded pie chart with sections identified by number is displayed. Microsoft Official Academic Course, Microsoft Word 2013
Step by Step: Select Data to Include in a Chart • Move the mouse pointer to the largest slice. The ScreenTip shows Series 1 Point 1 Value: 2010 (39%), as shown at right. This corresponds to the label 2010 rather than actual data. • Move to the second largest slice and you’ll see that the value is 1575, which is the amount for the total. Neither the column label (2010) nor the total sales amount should be included as pie slices. Microsoft Official Academic Course, Microsoft Word 2013
Step by Step: Select Data to Include in a Chart • Click in the chart’s white space and press Delete. The chart is now deleted and the CHART TOOLS tab disappears. • Select B3:B7, click the INSERT tab, in the Charts group, click Pie, and then click the first 2-D Pie chart. The correct data is displayed, but the chart is difficult to interpret with only numbers to identify the parts of the pie. • Click in the chart’s white space and press Delete. Microsoft Official Academic Course, Microsoft Word 2013
Step by Step: Select Data to Include in a Chart • Select A2:B7, click the INSERT tab, and click Pie in the Charts group. Click the first 2-D Pie chart. As illustrated atright, the data is clearly identified with a title and a label for each colored slice of the pie. • Move the mouse pointer to a blank spot within the chart and drag the chart to move it below the data. Microsoft Official Academic Course, Microsoft Word 2013
Step by Step: Select Data to Include in a Chart • Click outside of the chart, click FILE, and then click Print. Notice that the Annual Sales data appears with the chart on the page. • Press Esc and click on the Chart and choose FILE, Print. Now notice that the chart appears by itself. • CREATE a Lesson 12 folder and SAVE the workbook as 12 Charts Solution. • PAUSE. LEAVE the workbook open for the next exercise. Microsoft Official Academic Course, Microsoft Word 2013
Step by Step: Move a Chart • GET READY.USE the workbook from the previous exercise. • Click in the white space on the chart to select it. • On the DESIGN tab, click the Move Chart button. • In the Move Chart dialog box, click in the New sheet box and type 2010Pie to create the name of your new chart sheet (below). Microsoft Official Academic Course, Microsoft Word 2013
Step by Step: Move a Chart • Click OK. The chart becomes a separate sheet in the work-book (right). • Click on the Dataworksheet tab to return to the data portion of the workbook. • SAVE the workbook. • PAUSE. LEAVE the workbook open for the next exercise. Microsoft Official Academic Course, Microsoft Word 2013
Step by Step: Choose the Right Chart for Your Data • GET READY.USE the workbook from the previous exercise. • Select cells A2:F7. • Click the INSERTtab, and in the Charts group, click Column. In the Column drop-down list, move to each of the options. When you pause on an option, Excel shows a preview of the chart on the worksheet and a description and tips for the selected chart type. Under 3-D Column, move to the first option. The ScreenTip shows that the type of chart is a 3-D Clustered Column (above). Microsoft Official Academic Course, Microsoft Word 2013
Step by Step: Choose the Right Chart for Your Data • In the drop-down list, click 3-D Clustered Column. The column chart illustrates the sales for each of the revenue categories for the five-year period. The CHART TOOLS tab appears with the DESIGN tab active. • Anywhere in a blank area on the chart, click and drag the chart below the worksheet data and position it at the far left. • Click outside the column chart to deselect it. Notice that the CHART TOOLS tab disappears. Microsoft Official Academic Course, Microsoft Word 2013
Step by Step: Choose the Right Chart for Your Data • Select A2:F7, click the INSERT tab, and in the Charts group, click Line. In the 2-D Line group, click the Line with Markers option (first chart in the second row). Position the line chart next to the column chart. Note that the CHART TOOLS tab is on the ribbon with the DESIGN tab active (above). Microsoft Official Academic Course, Microsoft Word 2013
Step by Step: Choose the Right Chart for Your Data • Click the column chart and click the DESIGN tab. • Click the Move Chart button and in the New sheet box, type Column, and then click OK. • Click the Data worksheet tab, select the line chart, click the Move Chart button, and in the New sheet box, type Line, and then click OK. • SAVE the workbook. • PAUSE. LEAVE the workbook open for the next exercise. Microsoft Official Academic Course, Microsoft Word 2013
Step by Step: Use Recommended Charts • GET READY.USE the workbook from the previous exercise. • Click the Data worksheet tab. • Select the Year labels and Coffee and Espresso cells A2:F3, click the INSERTtab, and then click the Recommended Chartsbutton. Notice that Excel recommends four chart types (right). Excel explains when you use each of the charts underneath the example. Microsoft Official Academic Course, Microsoft Word 2013
Step by Step: Use Recommended Charts • Click the other three chart types and read each description. Click the Line chart, and then click OK. • Click the Move Chartbutton, and in the New sheet box, type CoffeeLine, and then click OK. • Click the Data work-sheet tab, select cells A2:B7 to include the labels and data for 2010, and then on the INSERT tab, click the Recommended Charts button. Notice the three chart types recommended this time (above). Microsoft Official Academic Course, Microsoft Word 2013
Step by Step: Use Recommended Charts • Click Cancel. Select A2:F7 and click the Recommended Charts button. Look at each of the suggested choices and scan the description. Click Cancel. • Select A8:F8 and click the Recommended Charts button. Notice that the choices are even different from the options at right. Click Cancel. Microsoft Official Academic Course, Microsoft Word 2013
Step by Step: Use Recommended Charts • Select A2:F2, hold down Ctrl, and select A8:F8. You do not have to choose adjacent ranges for your data. • Click the Recommended Charts button. Notice that the recommended choices at right are the same slide 28 because the first row includes years and the second row includes values. Click OK. Microsoft Official Academic Course, Microsoft Word 2013
Step by Step: Use Recommended Charts • Click the Move Chart button, and in the New sheet box, type TotalLine, and then click OK. • SAVE the workbook. • PAUSE. LEAVE the workbook open for the next exercise. Microsoft Official Academic Course, Microsoft Word 2013
Step by Step: Create a Bar Chart • GET READY.USE the workbook from the previous exercise. • Click the Data worksheet tab. • Select cells A2:F7and on the INSERT tab, in the Charts group, click the Bar button. • Click the 3-DClustered Bar subtype. The data is displayed in a clustered bar chart and the DESIGN tab is active on the CHART TOOLS tab. • Drag the clustered bar chart on the left below the worksheet data. • Select A2:F7. On the INSERT tab, in the Charts group, click the Bar button. • Click the 3-D Stacked Bar subtype. Microsoft Official Academic Course, Microsoft Word 2013
Step by Step: Create a Bar Chart • Position the stacked bar graph next to the 3-D bar graph. Your worksheet should look like the figure at right. • Click the Move Chartbutton, and in the New sheet box, type StackedBarand click OK. • Click the Data work-sheet tab, click the clustered bar chart, click the Move Chart button, and in the New sheet box, type ClusteredBar, then click OK. • SAVE the workbook. PAUSE. LEAVE the workbook open. Microsoft Official Academic Course, Microsoft Word 2013
Step by Step: Format a Chart with a Quick Style • GET READY.USE the workbook from the previous exercise. • Click on the 2010Piechart tab. If the DESIGN tab is not visible and the buttons active, click the whitespace inside the chart boundary and click the DESIGN tab. • One of the Chart Styles is already selected. Click each of the styles until you come to the style shown above with the labels and percentages shown next to each pie slice. Microsoft Official Academic Course, Microsoft Word 2013
Step by Step: Format a Chart with a Quick Style • Click the Change Colors button and move the mouse pointer over each of the different rows to see the preview of the pie change. • Click Color 3 to make the change. • SAVE the workbook. • PAUSE. LEAVE the workbook open for the next exercise. Microsoft Official Academic Course, Microsoft Word 2013
Step by Step: Format a Chart with Quick Layout • GET READY.USE the workbook from the previous exercise. • Click on the Column chart tab. • On the DESIGNtab, click the Quick Layoutbutton. As you move to each of the options, the chart changes to preview what the option will look like (above). Microsoft Official Academic Course, Microsoft Word 2013
Step by Step: Format a Chart with Quick Layout • Click Layout 5. The data table appears under the chart. The years (2010-2014) appear in both the data table and as x-axis labels. • SAVE the workbook. • PAUSE. LEAVE the workbook open for the next exercise. Microsoft Official Academic Course, Microsoft Word 2013
Step by Step: Edit and Add Text on Charts • GET READY.USE the workbook from the previous exercise. • Click the 2010Pie chart tab. • Click the 2010 title, move the insertion point to the end of the label and click. Type a space and then type Annual Sales. The text appears in all caps based on the current layout. Microsoft Official Academic Course, Microsoft Word 2013
Step by Step: Edit and Add Text on Charts • Select the label text. Click the HOME tab and click the Font dialog box launcher. The Font dialog box appears (below). • Click the All Caps check box to uncheck this option. Click OK. • Add today’s date in the text box. Microsoft Official Academic Course, Microsoft Word 2013
Step by Step: Edit and Add Text on Charts • Click on the FORMAT tab and click the Text Box button. Click the bottom left corner of the chart area and type your initials anEdit the chart titles on each of the charts as follows: Chart Title Text Column Chart Title Annual Sales Column Axis Title Thousands Line Chart Title Annual Sales (Thousands) StackedBar Chart Title Annual Sales ClusteredBar Chart Title Annual Sales • SAVE the workbook. • PAUSE. LEAVE the workbook open for the next exercise. Microsoft Official Academic Course, Microsoft Word 2013
Step by Step: Format a Data Series • GET READY.USE the workbook from the previous exercise. • Click the 2010Pie chart tab. • Click in the largest slice of the pie. You can see data selectors around each of the pie slices. • Click the FORMAT tab, click the Shape Fill button, and then choose Red in the Standard Colors section. All the slices of the pie change to red. Click Undo. You want to select the largest pie slice instead of all of the pie slices. Microsoft Official Academic Course, Microsoft Word 2013
Step by Step: Format a Data Series • Click the largest pie slice again and you should see data selectors only on the slice. Click the Shape Fill button and choose Red. The Coffee and Espresso pie slice changes to Red, as shown at right. • Click the Columnchart tab. Microsoft Official Academic Course, Microsoft Word 2013
Step by Step: Format a Data Series • Click the tallest bar (Coffee and Espresso). Notice that the five bars have data selectors. Click the Shape Fill button and select Red. All five bars and the legend color for Coffee and Espresso changes to red. • Click the Shape Effects button, click Bevel and notice the options available (right). Microsoft Official Academic Course, Microsoft Word 2013
Step by Step: Format a Data Series • Click the first Bevel option (Circle). Repeat this option for each of the data series. The chart now looks like the figure below. Microsoft Official Academic Course, Microsoft Word 2013
Step by Step: Format a Data Series • Besides the Shape Fill, Shape Outline, and Shape Effects buttons, you can change elements with the Shape Styles dialog box launcher. On the FORMAT tab, in the Shape Styles group, click the Shape Styles Dialog Box Launcher. The Format Data Series pane opens with the Series Options button selected. • Click each of the three buttons under the Series Options label and look at the choices. Click one of the Coffee Accessories columns. • Click the Fill and Line button, choose FILL, and select Picture or texture fill from the options. • Click the Texture drop-down arrow and choose the Brown Marble option. • SAVE the workbook. • PAUSE. LEAVE the workbook open for the next exercise. Microsoft Official Academic Course, Microsoft Word 2013
Step by Step: Change the Chart’s Border Line • GET READY.USE the workbook from the previous exercise. • Click the Line chart tab and choose the FORMAT tab. • In the Current Selection group, click the arrow in the Chart Elements selection box and click Chart Area. The chart area section on the chart becomes active. • Click the More arrow in the Shape Styles group. The Shape Styles gallery opens. Microsoft Official Academic Course, Microsoft Word 2013
Step by Step: Change the Chart’s Border Line • Scroll through the outline styles to locate Colored Outline – Blue, Accent 1, as shown below. • Click Colored Outline – Blue, Accent 1. You might not notice a change. This is because the Width of the line may be set so thin you can't see it. Microsoft Official Academic Course, Microsoft Word 2013
Step by Step: Change the Chart’s Border Line • In the Format Chart Area pane, click the BORDER arrow to expand that section. • In the Width up arrow, click until you get to 2.5 pt. Now you can see that the chart is outlined with a light blue border. • Click the Coffee and Espresso line. • In the Color drop-down, under the LINE section, choose Red. • SAVE your workbook. • PAUSE. LEAVE the workbook open for the next exercise. Microsoft Official Academic Course, Microsoft Word 2013
Step by Step: Modify a Chart’s Legend • GET READY.USE the workbook from the previous exercise. • Click the Line chart tab. • On the FORMAT tab, click Chart Elements drop-down arrow, and choose Legend. • If the Format Legend pane does not appear, click the Shape Styles dialog box launcher. • Click the Legend Options button. • In the Legend Position section, click Right to move the legend to the right side of the chart. • Click the Coffee and Espresso label in the legend. • Click the TEXT OPTIONS button to display the menus for the text. Microsoft Official Academic Course, Microsoft Word 2013
Step by Step: Modify a Chart’s Legend • In the Fill Color drop-down, choose Red so the text in the legend matches the color (below). • Click the 2010Pie chart tab. Microsoft Official Academic Course, Microsoft Word 2013
Step by Step: Modify a Chart’s Legend • Click the Coffee and Espresso label twice. If necessary, click the TEXT OPTIONS button and underneath TEXT FILL, click the Color button, and choose Red to change the text color. • CLOSE the Format Data Label pane and SAVE the workbook. • PAUSE. LEAVE the workbook open for the next exercise. Microsoft Official Academic Course, Microsoft Word 2013
Step by Step: Add Elements to a Chart • GET READY.USE the workbook from the previous exercise. • Click the StackedBar chart tab. • If necessary, click in a white space of the chart to select the chart and make the buttons in the upper right hand corner appear. Microsoft Official Academic Course, Microsoft Word 2013
Step by Step: Add Elements to a Chart • Click the CHART ELEMENTS button. A menu appears showing which elements are currently on the chart (checked boxes) and which are not (unchecked boxes). See the figure below. Microsoft Official Academic Course, Microsoft Word 2013
Step by Step: Add Elements to a Chart • Click the Axis Titles box to check the box and add both a vertical and horizontal axis placeholder. • The Axis Title on the bottom of the screen has selection indicators to indicate it is selected. Type Thousands and press Enter. • Click the TotalLine chart tab, click the CHART ELEMENTS, and select the Axis Titles option. This time the vertical Axis Title is selected. You can click any label placeholder to select it if it is already on a chart. Type Thousands for the vertical title. • Repeat the previous step to add a vertical axis title of Thousands for the CoffeeLine chart and the horizontal axis title for the ClusteredBar chart. Microsoft Official Academic Course, Microsoft Word 2013
Step by Step: Add Elements to a Chart • Click the StackedBar chart tab, click the CHART ELEMENTS, and select the Data Labels option. Labels appear for each of the bars on the chart as shown below. • SAVE the workbook. • PAUSE. LEAVE the workbook open for the next exercise. Microsoft Official Academic Course, Microsoft Word 2013
Step by Step: Delete Elements from a Chart • GET READY.USE the workbook from the previous exercise. • On the StackedBar chart sheet tab, click the vertical Axis Title and press Delete. • Repeat Step 1 to delete the following generic Axis Title labels: Chart tab Vertical or Horizontal Axis Title CoffeeLine Horizontal TotalLine Horizontal ClusteredBar Vertical Microsoft Official Academic Course, Microsoft Word 2013
Step by Step: Delete Elements from a Chart • Right-click the StackedBar chart tab and select Move or Copy. In the Before sheet list box, Select ClusteredBar, click the Create a copy check box, and then click OK to create another copy of the StackedBar chart. • Double-click the StackedBar (2) label for the tab and type SalesIncrease for the new name. • Click the $150 data label for the Bakery in 2014. All data labels for bakery have selection indicators. Press Delete. • Repeat Step 5 for Coffee Accessories, Packaged Coffee/Tea, and Deli data labels. • Click the Annual Sales title and type Coffee, Espresso, and Accessories only Consistent Sales Increase. Press Enter. Microsoft Official Academic Course, Microsoft Word 2013
Step by Step: Delete Elements from a Chart • You can also hide data series. Click the Chart Filters button on the right side of the chart and in the SERIES group, click Bakery to uncheck it (below). Microsoft Official Academic Course, Microsoft Word 2013
Step by Step: Delete Elements from a Chart • Repeat step 8 for Packaged Coffee/Tea and Deli and click the Apply button. • After looking at the chart, you might decide it is better to keep all of the data series. Repeat Steps 8 and 9 to recheck the Bakery, Packaged Coffee, and Deli. • SAVE the workbook. • PAUSE. LEAVE the workbook open for the next exercise. Microsoft Official Academic Course, Microsoft Word 2013
Step by Step: Add Additional Data Series • GET READY.USE the workbook from the previous exercise. • Right-click the Data worksheet tab, select Move or Copy, scroll to the bottom of the Before sheet list, and select (move to end). Click the Create a copy checkbox and click OK. Double-click the Data (2) tab, type DataExp, and then press Enter. • Select A2:F7, click the INSERT tab, click the Insert Column Chart button, and then under 2-D Column, click the Clustered Column option. Microsoft Official Academic Course, Microsoft Word 2013
Step by Step: Add Additional Data Series • Insert rows below Coffee and Espresso and Packaged Coffee/Tea. Edit the labels and values as shown below. Microsoft Official Academic Course, Microsoft Word 2013
Step by Step: Add Additional Data Series • Right-click in a blank area of the chart, and choose Select Data. The Select Data Source dialog box opens (below). Microsoft Official Academic Course, Microsoft Word 2013