Download
1 / 38
380 likes | 523 Views
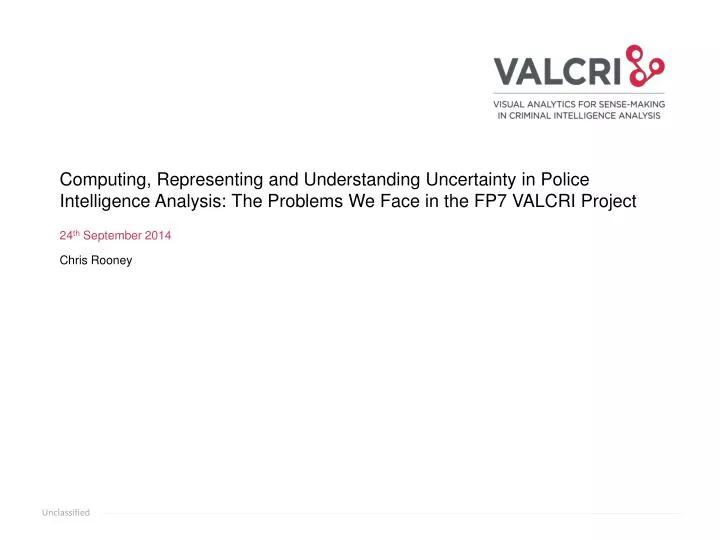
Computing, Representing and Understanding Uncertainty in Police Intelligence Analysis : The Problems W e Face in t he FP7 VALCRI Project. 24 th September 2014. Chris Rooney. Post Doc Researcher here at Middlesex Interested in: Novel human-computer interaction (soft and hard)

E N D
Computing, Representing and Understanding Uncertainty in Police Intelligence Analysis: The Problems We Face in the FP7 VALCRI Project 24th September 2014 Chris Rooney
Post Doc Researcher here at Middlesex Interested in: • Novel human-computer interaction (soft and hard) • Data visualisation on large (Powerwall) displays • Application of video game interaction to non-gaming environments Who am I?
Visual Analytics for Sense-Making in Criminal Intelligence Analysis
Visual Analytics for Sense-Making in Criminal Intelligence Analysis
Visual Analytics for Sense-Making in Criminal Intelligence Analysis
Visual Analytics for Sense-Making in Criminal Intelligence Analysis
VisualAnalytics for Sense-Making in Criminal Intelligence Analysis
VisualAnalytics for Sense-Making in Criminal Intelligence Analysis
(Semi) automatically analyse and extract meaningful information from multiple data types and datasets. Support analysts in the process of thinking and reasoning for situation reconstruction, discovery and insight generation. Enable the fluid and playful creation and assembly of tentative explanations of crimes that can evolve into rigorous arguments. Protect against cognitive biases and abuses that may arise from accidental or deliberate violations of ethical, legal and privacy principles. Marketing Spiel
Where we are Requirements Gathering Idea Generation Design Dec 2017 May 2014
Work Package 4 – Analyst User Interface Task 4.1 – Uncertainty Representation “To review the literature about uncertainty, how uncertainty propagates through a system, how humans understand the significance of uncertain data and its interaction in the flow or chain of evidence, and particularly in the context of decision making to create actionable intelligence. Review and consider the usability of quantitatively specified probabilities e.g. 85%, with broad estimates, e.g. very likely to happen, and their usefulness in intelligence analysis, for different types of problems e.g. events occurring, spread or diffusion of a gas over a geographical area, decay of an event. Develop design concepts for representing uncertainty, for uncertainty propagation and dispersion, designs to find and remove events or data of low or given probabilities to re-assess the effects of their removal on overall outcomes. Test designs with end-user groups. Integrate the designs within the UI concepts and architecture.” Why I am here
“Visual analytics is the science of analytical reasoning facilitated by interactive visual interfaces” James J. Thomas (Editor), Kristin A. Cook (Editor), Illuminating the Path: The Research and Development Agenda for Visual Analytics Paperback, NVAC, January 1, 2005 “Visual analytics is an outgrowth of the fields of scientific and information visualization but includes technologies from many other fields, including knowledge management, statistical analysis, cognitive science, decision science, and many more.” Pak Chung Wong; Thomas, J., "Visual Analytics," Computer Graphics and Applications, IEEE , vol.24, no.5, pp.20,21, Sept.-Oct. 2004 Visual Analytics
Visual Analytics Pipeline User Interaction Correa, C.; Yu-Hsuan Chan; Kwan-Liu Ma, "A framework for uncertainty-aware visual analytics," Visual Analytics Science and Technology, 2009. VAST 2009. IEEE Symposium on , vol., no., pp.51,58, 12-13 Oct. 2009
Intelligence uncertainty Evidential uncertainty Hypothesis uncertainty Computational uncertainty Four Examples of Uncertainty
5x5x5 Intelligence Report “The 5x5x5 should be used to record and information for a policing purpose that is generally not recorded on other systems. The 5x5x5 can be used during routine, volunteered and task information collection.” - From an Introduction to Intelligence-Led Policing Examples include information given in confidence, anonymous sources, or sanitised information. Intelligence Uncertainty
Descriptive uncertainty Temporal uncertainty Spatial uncertainty Evidential Uncertainty
Witness report 1 He looked really strange, he had lots of makeup on, and a really colourful outfit. His hair was sticking out of either side on his head and he was mostly bald on top. He had brightly coloured clothes and really big shoes. The two things I remember most are his red nose and the way he kept smiling, it was almost like he wanted to be me friend. Witness report 2 He looked like something you would only see at Halloween, with a face full of makeup, and a really colourful outfit. His hair was sticking out of either side on his head and he was bald on top. He had brightly coloured clothes and really big shoes. The two things I remember most are his red nose and the way he had this intense smile, it was like he wanted to eat me. Descriptive Uncertainty
Interviews with Antwerp Federal Police Discussed a missing persons case Anonymised for demonstration purposes Spatial and Temporal Uncertainty Video removed
Temporal Uncertainty Video removed
Temporal Uncertainty Aigner, W.; Miksch, S.; Thurnher, B.; Biffl, S., "PlanningLines: novel glyphs for representing temporal uncertainties and their evaluation," Information Visualisation, 2005. Proceedings. Ninth International Conference on , vol., no., pp.457,463, 6-8 July 2005
Spatial Uncertainty (resolution) Video removed
Spatial Uncertainty R.S. Allendes Osorio and K.W. Brodlie. Contouring with Uncertainty. In6th Theory and Practice of Computer Graphics Conference, pp. 59--66, 2008.
Reducing Spatial Uncertainty -> Increasing Resolution Video removed
Hypothesis uncertainty Video removed
Hypothesis uncertainty Analysis of competing hypotheses Heuer, Richards J., Jr, "Chapter 8: Analysis of Competing Hypotheses", Psychology of Intelligence Analysis, Center for the Study of Intelligence, Central Intelligence Agency
Hypothesis uncertainty Reuschel &Hurni, Mapping Literature: Visualisation of Spatial Uncertainty in Fiction, The Cartographic Journal, The British Cartographic Society, 2011
Comparative Case Analysis as an Example Computational uncertainty
Feature Vector • Contains meta data such as: • location, date, time, type, … • These are considered as hard features. • Contains generated features (of user’s interest) • heuristics based • These are considered as soft features.
0.8 0.5 1 C a se 1 1 0.15 C a se 2 1 C a se 3 Case4 Computational Components • Case2 • Case3 • Case1 • Case4 0.73 1 0.3 0.42 Similarity Measure – how similar two objects are, based on a selection of attributes/features Similarity Matrix – similarity between pairwise objects
Visualization – Dynamic Query Shoe Car Weekday Daytime Age X O O O BLACK SHOES RED SHOES LEATHER SHOES BLUE SHOES
Visualization – Overlapping Sets RED SHOES BOND STREET SUNDAY EVENING