Download
1 / 104
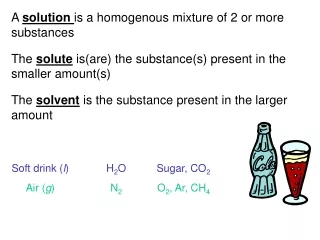
1.04k likes | 1.14k Views
F. D L. F. L. L 0. a. L 0. F. A 0. a. b. F. Fig.: 4.1. Chapter 4.1: Lüpke, T.: Fundamental Principles of Mechanical Behaviour. In: Grellmann, W., Seidler, S. (Eds .): Polymer Testing. Carl Hanser Verlag, Munich (2013) 2. Edition. z. D. y. t. s. yz. s. zz. A. C. t. xz. x.

E N D
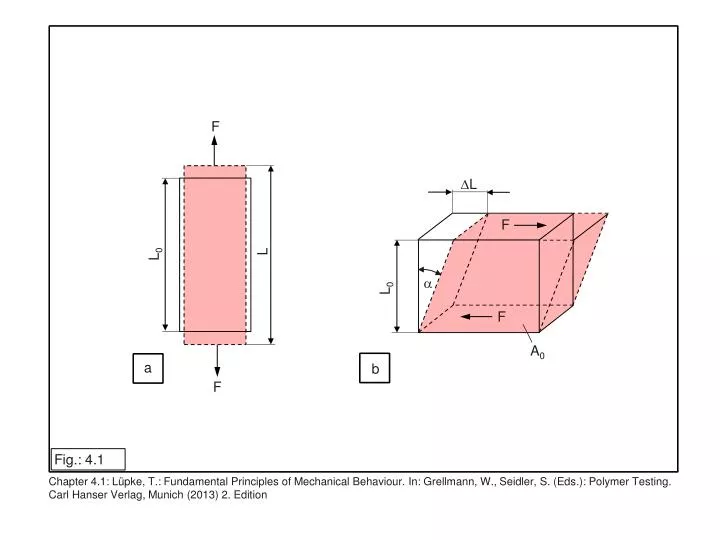
F DL F L L0 a L0 F A0 a b F Fig.: 4.1 Chapter 4.1: Lüpke, T.: Fundamental Principles of Mechanical Behaviour. In: Grellmann, W., Seidler, S. (Eds.): Polymer Testing. Carl Hanser Verlag, Munich (2013) 2. Edition
z D y t s yz s zz A C t xz x B Fig.: 4.2 Chapter 4.1: Lüpke, T.: Fundamental Principles of Mechanical Behaviour. In: Grellmann, W., Seidler, S. (Eds.): Polymer Testing. Carl Hanser Verlag, Munich (2013) 2. Edition
z s zz t t yz xz t zy t zx s t t yy xy yx s xx y x Fig.: 4.3 Chapter 4.1: Lüpke, T.: Fundamental Principles of Mechanical Behaviour. In: Grellmann, W., Seidler, S. (Eds.): Polymer Testing. Carl Hanser Verlag, Munich (2013) 2. Edition
Voigt-Kelvin Maxwell Fig.: 4.4 Chapter 4.1: Lüpke, T.: Fundamental Principles of Mechanical Behaviour. In: Grellmann, W., Seidler, S. (Eds.): Polymer Testing. Carl Hanser Verlag, Munich (2013) 2. Edition
E E E E i 3 2 1 E ∞ h h h h 1 2 i 3 t t t t 2 1 i 3 Fig.: 4.5 Chapter 4.1: Lüpke, T.: Fundamental Principles of Mechanical Behaviour. In: Grellmann, W., Seidler, S. (Eds.): Polymer Testing. Carl Hanser Verlag, Munich (2013) 2. Edition
Ds(t) 1 stress s s(t) 0 Ds(t) 2 e(t) 1 e(t) = e (t) + e (t) strain e 2 1 0 e(t) 2 t t time t 1 2 Fig.: 4.6 Chapter 4.1: Lüpke, T.: Fundamental Principles of Mechanical Behaviour. In: Grellmann, W., Seidler, S. (Eds.): Polymer Testing. Carl Hanser Verlag, Munich (2013) 2. Edition
effective range T log E 0 T 1 T 3 T 2 master curve log a T log (t) log (t ) log t 0 Fig.: 4.7 Chapter 4.1: Lüpke, T.: Fundamental Principles of Mechanical Behaviour. In: Grellmann, W., Seidler, S. (Eds.): Polymer Testing. Carl Hanser Verlag, Munich (2013) 2. Edition
b a 2 1 s s stresss stresss F S straine straine a) b) 1 – nominal (engineering) stress – strain curve 2 – true stress – strain curve Fig.: 4.8 Chapter 4.1: Lüpke, T.: Fundamental Principles of Mechanical Behaviour. In: Grellmann, W., Seidler, S. (Eds.): Polymer Testing. Carl Hanser Verlag, Munich (2013) 2. Edition
s = const. e = const. 0 0 strain e stress s stress s time t time t time t e (t) strain e s (t) time t Fig.: 4.9 Chapter 4.2: Lüpke, T.: Mechanical Spectroscopy. In: Grellmann, W., Seidler, S. (Eds.): Polymer Testing. Carl Hanser Verlag, Munich (2013) 2. Edition
e e (t) 0 s 0 s (t) stress s strain e time t 1/f d/w Fig.: 4.10 Chapter 4.2: Lüpke, T.: Mechanical Spectroscopy. In: Grellmann, W., Seidler, S. (Eds.): Polymer Testing. Carl Hanser Verlag, Munich (2013) 2. Edition
i * E E’’ d j E’ Fig.: 4.11 Chapter 4.2: Lüpke, T.: Mechanical Spectroscopy. In: Grellmann, W., Seidler, S. (Eds.): Polymer Testing. Carl Hanser Verlag, Munich (2013) 2. Edition
4 3 2 1 1 2 3 a b 1 – prismatic specimen 2 – clamping device 3 – oscillating weight 4 – counterweight Fig.: 4.12 Chapter 4.2: Lüpke, T.: Mechanical Spectroscopy. In: Grellmann, W., Seidler, S. (Eds.): Polymer Testing. Carl Hanser Verlag, Munich (2013) 2. Edition
Dl 0 deflection Dl An+1 An time t 0 1/f Fig.: 4.13 Chapter 4.2: Lüpke, T.: Mechanical Spectroscopy. In: Grellmann, W., Seidler, S. (Eds.): Polymer Testing. Carl Hanser Verlag, Munich (2013) 2. Edition
1 max Df i 0.707 amplitude A/A 0 f i frequency f Fig.: 4.14 Chapter 4.2: Lüpke, T.: Mechanical Spectroscopy. In: Grellmann, W., Seidler, S. (Eds.): Polymer Testing. Carl Hanser Verlag, Munich (2013) 2. Edition
textile filaments clamp to amplifier specimen specimen to amplifier from generator from generator method A method B Fig.: 4.15 Chapter 4.2: Lüpke, T.: Mechanical Spectroscopy. In: Grellmann, W., Seidler, S. (Eds.): Polymer Testing. Carl Hanser Verlag, Munich (2013) 2. Edition
10 10 glassy state rubber-elastic plateau glass transition flow region 8 10 6 10 1 10 E‘‘ (Pa) E‘ (Pa) 4 10 0 10 tan d 2 10 -1 10 a g b t t t log t Fig.: 4.16 Chapter 4.2: Lüpke, T.: Mechanical Spectroscopy. In: Grellmann, W., Seidler, S. (Eds.): Polymer Testing. Carl Hanser Verlag, Munich (2013) 2. Edition
1 10 10 10 0 10 8 10 tan d E‘‘ (Pa) E‘ (Pa) -1 10 6 10 -2 4 10 10 -50 50 150 -150 -100 0 100 T T g b T (°C) Fig.: 4.17 Chapter 4.2: Lüpke, T.: Mechanical Spectroscopy. In: Grellmann, W., Seidler, S. (Eds.): Polymer Testing. Carl Hanser Verlag, Munich (2013) 2. Edition
10 10 effective range master curve 0.1 ... 50 Hz T = 25 °C 0 9 10 T = 0 °C Arrhenius-plot 15 8 E‘ (Pa) 10 T ln (a ) 5 -5 7 10 -1 DH = 430 kJ mol -15 3.1 3.3 3.5 3.7 1/T (1000/K) 6 T = 50 °C 10 -6 -4 -2 0 2 4 6 10 10 10 10 10 10 10 f (Hz) Fig.: 4.18 Chapter 4.2: Lüpke, T.: Mechanical Spectroscopy. In: Grellmann, W., Seidler, S. (Eds.): Polymer Testing. Carl Hanser Verlag, Munich (2013) 2. Edition
increasing crosslink density increasing crystallinity log E‘ increasing molecular weight T Fig.: 4.19 Chapter 4.2: Lüpke, T.: Mechanical Spectroscopy. In: Grellmann, W., Seidler, S. (Eds.): Polymer Testing. Carl Hanser Verlag, Munich (2013) 2. Edition
10 10 PB 9 PS 10 SBR 8 10 SBS E‘ (Pa) 7 10 6 10 5 10 3 2 tan d 1 0 -150 -100 -50 0 50 100 150 200 250 T (°C) Fig.: 4.20 Chapter 4.2: Lüpke, T.: Mechanical Spectroscopy. In: Grellmann, W., Seidler, S. (Eds.): Polymer Testing. Carl Hanser Verlag, Munich (2013) 2. Edition
a s e s c b s s e 0 0 0 e e t t 0 Fig.: 4.21 Chapter 4.3: Bierögel, C.: Quasi-Static Test Methods. In: Grellmann, W., Seidler, S. (Eds.): Polymer Testing. Carl Hanser Verlag, Munich (2013) 2. Edition
s s s b c a pure retardation without influence of time pure relaxation e s e e e s d with influence of time s e e Fig.: 4.22 Chapter 4.3: Bierögel, C.: Quasi-Static Test Methods. In: Grellmann, W., Seidler, S. (Eds.): Polymer Testing. Carl Hanser Verlag, Munich (2013) 2. Edition
4 4 10 10 a b PS PVC PS PS-HI PVC 3 PS-HI 10 3 10 E (MPa) E (MPa) t t PE-HD PE-HD PE-LD PE-LD 2 2 10 10 2 -2 0 3 4 1 -1 -4 -3 -40 -20 20 40 0 60 10 10 10 10 10 10 10 10 10 T (°C) t (s) Fig.: 4.23 Chapter 4.3: Bierögel, C.: Quasi-Static Test Methods. In: Grellmann, W., Seidler, S. (Eds.): Polymer Testing. Carl Hanser Verlag, Munich (2013) 2. Edition
cross-head A 01 0 cross-section DL s (t) L 0 h L 0 02 b L DL z 0 traverse path DL y D x L F v T F x DL (x) L DL t t = 0 1 DL DL (t) 2 DL 3 DL 4 DL(t)= DL + DL + DL + DL 4 3 2 1 Fig.: 4.24 Chapter 4.3: Bierögel, C.: Quasi-Static Test Methods. In: Grellmann, W., Seidler, S. (Eds.): Polymer Testing. Carl Hanser Verlag, Munich (2013) 2. Edition
normative strain rate of dumb- bell specimen 0 n ormative = nominal strain L L rate of prismatic specimen average nominal strain rate of dumbbell specimen DL -1 e (s ) F Fig.: 4.25 Chapter 4.3: Bierögel, C.: Quasi-Static Test Methods. In: Grellmann, W., Seidler, S. (Eds.): Polymer Testing. Carl Hanser Verlag, Munich (2013) 2. Edition
1A 1B 1BA 5A 2 5 4 b 1 0 1 2 3 l l l L L 1BB 5B r d b 2 Fig.: 4.26 Chapter 4.3: Bierögel, C.: Quasi-Static Test Methods. In: Grellmann, W., Seidler, S. (Eds.): Polymer Testing. Carl Hanser Verlag, Munich (2013) 2. Edition
b a b s F 0 2 2 e b s = f(e) e = f(e) q1 q 1 2 DF s (MPa) F (N) b (mm) 1 e (%) Db = b - b q s b e F 1 q2 2 1 DL – DL DL – DL 02 01 02 01 s F 0 v DL DL DL DL DL 02 02 01 01 v DL (mm) DL (mm) 0 0 e e e e e 2 2 0 1 1 e (%) e (%) Fig.: 4.27 Chapter 4.3: Bierögel, C.: Quasi-Static Test Methods. In: Grellmann, W., Seidler, S. (Eds.): Polymer Testing. Carl Hanser Verlag, Munich (2013) 2. Edition
a s = s B M s = s B M s y b s (MPa) s = s c y M s B d s = s B M s x s B e e = e e = e e x B B M M e = e y M e e (%) y e e tB tB e = e tB tM e (%) t Fig.: 4.28 Chapter 4.3: Bierögel, C.: Quasi-Static Test Methods. In: Grellmann, W., Seidler, S. (Eds.): Polymer Testing. Carl Hanser Verlag, Munich (2013) 2. Edition
e e e e e t t s M s = s s y M B s = s e s y M y y s s (MPa) B e or e (%) t Fig.: 4.29 Chapter 4.3: Bierögel, C.: Quasi-Static Test Methods. In: Grellmann, W., Seidler, S. (Eds.): Polymer Testing. Carl Hanser Verlag, Munich (2013) 2. Edition
125 a T decreasing e increasing 100 75 s (MPa) 50 125 b 25 100 0 0 50 100 150 200 75 s (MPa) e (%) 50 25 Fig.: 4.30 0 Chapter 4.3: Bierögel, C.: Quasi-Static Test Methods. In: Grellmann, W., Seidler, S. (Eds.): Polymer Testing. Carl Hanser Verlag, Munich (2013) 2. Edition 0 50 100 150 200 e (%)
a elongation without necking elongation with necking s (MPa) 1 2 3 4 5 6 7 s = f (e) 1 linear-elastic region 2 linear-viscoelastic region 3 non-linear viscoelastic region necking region 4 steady-state plastic yielding 5 strain-hardening region 6 ultimative failure ─ fracture 7 b e (%) D e = f (e) e (%/min) e defect density Q t Q = f (e) D e (%) Fig.: 4.31 Chapter 4.3: Bierögel, C.: Quasi-Static Test Methods. In: Grellmann, W., Seidler, S. (Eds.): Polymer Testing. Carl Hanser Verlag, Munich (2013) 2. Edition
l e l 2 l m m 1 b b r 2 b l 1 l red L Fig.: 4.32 Chapter 4.3: Bierögel, C.: Quasi-Static Test Methods. In: Grellmann, W., Seidler, S. (Eds.): Polymer Testing. Carl Hanser Verlag, Munich (2013) 2. Edition
1.5 100 1.5 a b e = f (e) 1.2 80 1.2 e = f (e) e t 0.9 60 e (%/min) 0.9 s (MPa) s = f (e) e (%/min) s = f (e) 0.6 40 0.6 0.3 20 0.3 0 0 0 0 2 4 6 8 10 0 3 6 9 10 12 e (%) e (%) Fig.: 4.33 Chapter 4.3: Bierögel, C.: Quasi-Static Test Methods. In: Grellmann, W., Seidler, S. (Eds.): Polymer Testing. Carl Hanser Verlag, Munich (2013) 2. Edition
100 a 90° R19 notch R12.7 120 R25.4 clamp mark 28.4 27 notch 50 b 25 15° 75° 25 25 Fig.: 4.34 Chapter 4.3: Bierögel, C.: Quasi-Static Test Methods. In: Grellmann, W., Seidler, S. (Eds.): Polymer Testing. Carl Hanser Verlag, Munich (2013) 2. Edition
14 a b F F 12 max 10 8 F (N) 6 4 parallel perpendicular to the processing direction 2 v T 0 F 0 10 20 30 40 Dl (mm) Fig.: 4.35 Chapter 4.3: Bierögel, C.: Quasi-Static Test Methods. In: Grellmann, W., Seidler, S. (Eds.): Polymer Testing. Carl Hanser Verlag, Munich (2013) 2. Edition
z y x upper pressure plate F A 01 0 cross-section DL s (t) 02 DL 0 d L L b A = b d 0 F F lower pressure plate traverse path DL= DL − DL 01 02 Fig.: 4.36 Chapter 4.3: Bierögel, C.: Quasi-Static Test Methods. In: Grellmann, W., Seidler, S. (Eds.): Polymer Testing. Carl Hanser Verlag, Munich (2013) 2. Edition
tube cylinder prism x y z l l l d d d b i d a 4 p p 3 d b d 4 4 (d − d ) I = I = I = y a i y y 64 12 64 2 p p d 2 2 (d − d ) A = b d A = A = a i 0 4 0 0 4 4 4 (d − d ) l d l d l a i l = l = l = 2 2 4 4 3.46 (d − d ) a i Fig.: 4.37 Chapter 4.3: Bierögel, C.: Quasi-Static Test Methods. In: Grellmann, W., Seidler, S. (Eds.): Polymer Testing. Carl Hanser Verlag, Munich (2013) 2. Edition
80 a 50 10 c b 10 10 50 4 10 4 Fig.: 4.38 Chapter 4.3: Bierögel, C.: Quasi-Static Test Methods. In: Grellmann, W., Seidler, S. (Eds.): Polymer Testing. Carl Hanser Verlag, Munich (2013) 2. Edition
sM sB sy b sM=sB c s (MPa) sM=sB a d sx eB eM = eB eM eM = eB ex ey e (%) ecB ecM ecy ecM = ecB ec (%) Fig.: 4.39 Chapter 4.3: Bierögel, C.: Quasi-Static Test Methods. In: Grellmann, W., Seidler, S. (Eds.): Polymer Testing. Carl Hanser Verlag, Munich (2013) 2. Edition
PS compression test sy s (MPa) sM shear bands PS tensile test crazes e (%) eM = eB ey Fig.: 4.40 Chapter 4.3: Bierögel, C.: Quasi-Static Test Methods. In: Grellmann, W., Seidler, S. (Eds.): Polymer Testing. Carl Hanser Verlag, Munich (2013) 2. Edition
a b bending jaw anvil F variable radii specimen specimen F support positioning slide L/3 v v T T l l l traverse L traverse a a b bending moment Mb M b Mb M max F M Q = max transverse force Q 2 Q = 0 F Q = F F 2 Q = + Q = + Q 2 2 Q F l F L a M = M = max 2 max 4 Fig.: 4.41 Chapter 4.3: Bierögel, C.: Quasi-Static Test Methods. In: Grellmann, W., Seidler, S. (Eds.): Polymer Testing. Carl Hanser Verlag, Munich (2013) 2. Edition
a z h F EI y y f b L/2 c b -s z z -e z max max y y y h h x x x t +s +e t max max max Fig.: 4.42 Chapter 4.3: Bierögel, C.: Quasi-Static Test Methods. In: Grellmann, W., Seidler, S. (Eds.): Polymer Testing. Carl Hanser Verlag, Munich (2013) 2. Edition
a F deflection sensor anvil f v support T traverse b F fork sensor anvil f v support T traverse Fig.: 4.43 Chapter 4.3: Bierögel, C.: Quasi-Static Test Methods. In: Grellmann, W., Seidler, S. (Eds.): Polymer Testing. Carl Hanser Verlag, Munich (2013) 2. Edition
a 4 10 80 b b B h length direction of the product (processing direction) D b C A h h b b h width direction of the product Fig.: 4.44 Chapter 4.3: Bierögel, C.: Quasi-Static Test Methods. In: Grellmann, W., Seidler, S. (Eds.): Polymer Testing. Carl Hanser Verlag, Munich (2013) 2. Edition
sfM=sfB a sfM b sfB sfC c s (MPa) sx f ex efB efM efB ef (%) fB fB fC fM f (mm) Fig.: 4.45 Chapter 4.3: Bierögel, C.: Quasi-Static Test Methods. In: Grellmann, W., Seidler, S. (Eds.): Polymer Testing. Carl Hanser Verlag, Munich (2013) 2. Edition
200 s (MPa) PP/GF 180 f 50 wt.-% 160 140 40 wt.-% 120 100 30 wt.-% 80 20 wt.-% 60 10 wt.-% 40 0 wt.-% 20 0 0.5 1.0 1.5 2.0 2.5 3.0 3.5 4.0 0 ef (%) Fig.: 4.46 Chapter 4.3: Bierögel, C.: Quasi-Static Test Methods. In: Grellmann, W., Seidler, S. (Eds.): Polymer Testing. Carl Hanser Verlag, Munich (2013) 2. Edition
CHARPY arrangement IZOD arrangement impact direction F anvil F anvil impact direction support specimen support span specimen support Fig.: 4.47 Chapter 4.4: Impact Loading. In: Grellmann, W., Seidler, S. (Eds.): Polymer Testing. Carl Hanser Verlag, Munich (2013) 2. Edition
1.6 b 1.2 -2 40 a A PVC Nylon a (kJ m ) 0.8 iN D B 30 0.4 C -2 0.0 POM -1 -2 0 a (kJ m ) 10 10 10 20 cN r (mm) ABS PMMA 10 0 0 1 10 10 r (mm) Fig.: 4.48 Chapter 4.4: Impact Loading. In: Grellmann, W., Seidler, S. (Eds.): Polymer Testing. Carl Hanser Verlag, Munich (2013) 2. Edition
500 a a 400 cN cN a 2 1 cN 1 300 F (N) a cN 2 200 100 0 0.0 0.5 1.0 1.5 2.0 2.5 f (mm) Fig.: 4.49 Chapter 4.4: Impact Loading. In: Grellmann, W., Seidler, S. (Eds.): Polymer Testing. Carl Hanser Verlag, Munich (2013) 2. Edition
Fig.: 4.50 Chapter 4.4: Impact Loading. In: Grellmann, W., Seidler, S. (Eds.): Polymer Testing. Carl Hanser Verlag, Munich (2013) 2. Edition