Download
1 / 3
30 likes | 193 Views
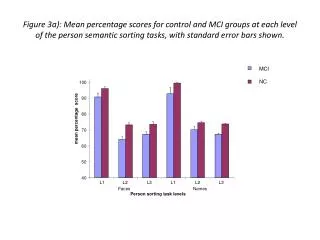
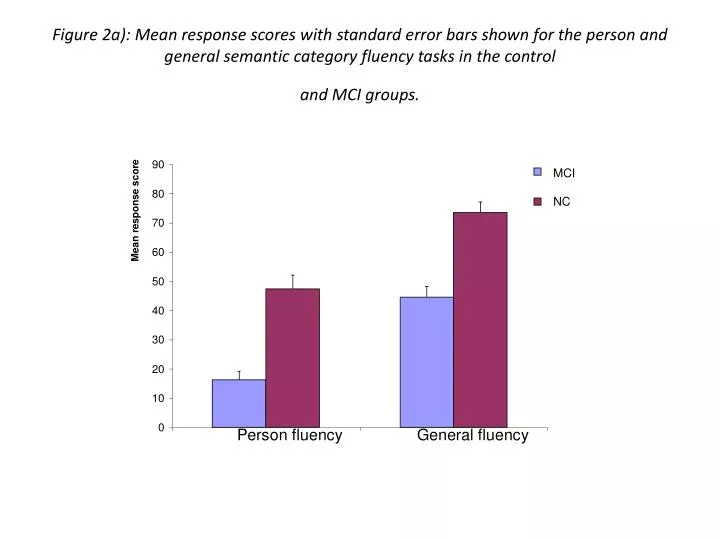
Figure 2a): Mean response scores with standard error bars shown for the person and general semantic category fluency tasks in the control and MCI groups. MCI NC.

E N D
Figure 2a): Mean response scores with standard error bars shown for the person and general semantic category fluency tasks in the controland MCI groups. MCI NC
Figure 2b): Mean percentage scores with standard error bars shown for the person and general semantic naming tests in the control and MCI groups MCI NC
Figure 2c): Mean percentage scores with standard error bars shown for the person naming and person identification tasks in the control and MCI groups. MCI NC