Download
1 / 117
1.18k likes | 1.33k Views
Student Demographic Projections, Public Policy Questions and the Impact on Higher Education. Knowing who is (and is not) knocking at the college door Becky Brodigan NEAIR Annual Meeting Middlebury College November, 2006.

E N D
Student Demographic Projections, Public Policy Questions and the Impact on Higher Education Knowing who is (and is not) knocking at the college door Becky Brodigan NEAIR Annual Meeting Middlebury College November, 2006 November 2006 NEAIR -- The Changing Demographics of Higher Education
“These findings can be very helpful in helping shape public policy. Many folks may not like the implications of these findings, but they are the facts, and we ignore them at our peril.” David Longenecker, Executive Director, WICHE, The Chronicle of Higher Education 2/24/2006 November 2006 NEAIR -- The Changing Demographics of Higher Education
IS this much ado about nothing or do we ignore at our peril? You decide • Demographic changes are one piece of a complex puzzle • Income and gender are two others that we will talk about that haven’t received much attention or analysis November 2006 NEAIR -- The Changing Demographics of Higher Education
Things to think about today… • What is the environment within which we operate? • What is happening in our state and region? • Where do our students come from (at our institutions)? • Where do students from our state go? • Where do non-residents come from to our schools? • Will these changes impact career colleges, community colleges, state colleges, public flagships and different varieties of privates differently? November 2006 NEAIR -- The Changing Demographics of Higher Education
Things to think about today… Context… What’s happening to ALL of education? • NCLB (N$LB) – • states under attack, threats to pull back federal funding • Pressure to allow students to transfer (what about those who can’t – are they left behind) • Effects spilling over into higher education policy November 2006 NEAIR -- The Changing Demographics of Higher Education
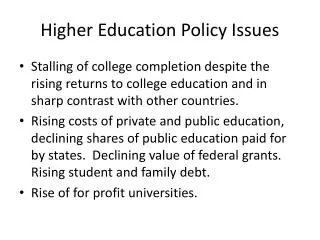
The Effects of Accountability Movements and Efforts like NCLB • Testing at the federal and collegiate level (CLA)? • New definitions of “college material?” • During the next two decades will access and the number of students going to college expand or will opportunities contract? November 2006 NEAIR -- The Changing Demographics of Higher Education
More than 50% 36% to 50% 21% to 35% 10% to 20% Less than 10% Minority School Enrollments Source: U.S. Department of Education November 2006 NEAIR -- The Changing Demographics of Higher Education
Some sobering facts about schools • Public secondary education is resegregating at accelerating rates, despite the growing minority student population across the country. • Nationwide • 70% of Black students attend minority majority schools, • White students are the most segregated group, they typically attend schools where less than 20 percent of students are from other racial and ethnic groups. November 2006 NEAIR -- The Changing Demographics of Higher Education
Some sobering facts about schools • Minority schools are more highly correlated with high poverty schools; • tend to have lower parental participation; • maintain fewer resources; and • have less experienced classroom teachers with higher turnover than white schools. Source: André Bell, MRO, The College Board November 2006 NEAIR -- The Changing Demographics of Higher Education
Demographic changes • First talked about in the late 70’s -- higher education ignored • Recently, College Board has been the leading voice in the discussion on the national level • http://www.collegeboard.com/highered/de/index.html • Moody’s recently published a paper November 2006 NEAIR -- The Changing Demographics of Higher Education
What will we look at? • High School Graduation Projections through 2018 • by race • by region • College Going Rates by Race, Gender and SES • Current Enrollment Patterns by State November 2006 NEAIR -- The Changing Demographics of Higher Education
What will we look at? • Enrollment Patterns by Race and Gender • Migration Data • Public Policy Issues – recent research • Your part -- What do we think this all means? November 2006 NEAIR -- The Changing Demographics of Higher Education
Policy Related Implications for Higher Education and State Policy Makers • What can change these projections? Are there likely to be improvements or decreases in graduation rates by any groups? • In the Northeast, maintaining market share will lead to declines in enrollment for individual institutions. Will enrollment shift sectors? How will legislatures respond to theses shifts? November 2006 NEAIR -- The Changing Demographics of Higher Education
Policy Related Implications for Higher Education and State Policy Makers • What are the implications for tax revenues and per capita income if the percent of college graduates decreases? • Will new populations of students graduate in the same patterns as their predecessors? (Majors, time to degree, students and sports?) • Do our faculty and staff reflect mirror the new demographics? How will that affect our ability to recruit and retain students? November 2006 NEAIR -- The Changing Demographics of Higher Education
Challenges of the Perfect Demographic Storm • How can we reduce barriers to college access for low-income and minority students? • ImproveK-12 preparation • Admission and financial aid policies and processes • Improve Retention • If we succeed, how will we find adequate funding (Federal, State, Institutional) to support increasing financial need? November 2006 NEAIR -- The Changing Demographics of Higher Education
WICHE Projections • Public and Non-public high school graduation data since 1960 • Actual from 87-88 through 01-02 • Projections from 01-02 to 2017-18 • Included details descriptions and formulas of the ‘aging’ process as well as detailed notes by state November 2006 NEAIR -- The Changing Demographics of Higher Education
WICHE Data • Historical and projection tables for public schools with total births, public enrollments by grade, and high school graduates, including progression ratios; • Historical and projection tables for each racial/ethnic group with births, public enrollments by grade, and high school graduates, including progression ratios; • Historical and projection tables for nonpublic schools in each state with total births, nonpublic enrollments by grade, and high school graduates, including progression ratios; • Detailed notes for each state explaining the sources of the historical data that underlie the projections and the methods used to generate the projections. • Historical and projection tables for income brackets in each state with public enrollments by grade and high school graduates, including progression ratios. • Projections extend to the year 2017-18. Birth data are from the National Center for Health Statistics’ Monthly Vital Statistics reports providing final birth data for each year. Enrollment and graduate data are collected primarily from the state education agencies. When state data were incomplete, other sources were used and are detailed in the notes for each state. November 2006 NEAIR -- The Changing Demographics of Higher Education
Number of Public High School Graduates Peaks and Valleys … Source: WICHE/The College Board November 2006 NEAIR -- The Changing Demographics of Higher Education
College 'bubble' is about to burst (Philadelphia Inquirer – 7/31/2006) • Administrators at local private institutions as diverse as Chestnut Hill College, Drexel University, St. Joseph's University, and two-year Harcum College in Bryn Mawr say they already are preparing for the coming shortage. In an effort to maintain the dramatic enrollment gains they've made, many are extending their recruiting efforts to faster-growing states, as well as adopting new academic programs to appeal to a wider pool of students. November 2006 NEAIR -- The Changing Demographics of Higher Education
Enrollment at colleges and universities: 1947 to 2004 (Census Bureau) November 2006 NEAIR -- The Changing Demographics of Higher Education
Projections of HS Graduates in the United States November 2006 NEAIR -- The Changing Demographics of Higher Education
Projections of HS Graduates United States: 2006-07 to 2017-18 November 2006 NEAIR -- The Changing Demographics of Higher Education
Transition and Completion Measures from High School to College November 2006 NEAIR -- The Changing Demographics of Higher Education
Tomás Rivera Study18-24 year old California Latinos • 400 person sample • 200 who had never attended college and 200 who had attended college • Interviews were in English and/or Spanish • Sample representative of Latinos in US except over 75% were HS graduates • Median income was $25,000 to $35,000 • 83% US born • 72% had at least one foreign born parent November 2006 NEAIR -- The Changing Demographics of Higher Education
Tomás Rivera Study18-24 year old California Latinos • 98% said it was important to have a college education • 38% did not feel the benefits outweighed the costs • Not being able to work and incurring debt were opportunity costs associated with attending college November 2006 NEAIR -- The Changing Demographics of Higher Education
Tomás Rivera Study18-24 year old California Latinos • Over 50% erroneously thought you had to be a US citizen to apply for financial aid • Few respondents could accurately estimate the cost of attending either UC or Cal State Univ – most overestimated the cost • There is a lack for familiarity with Cal Grants and federal grants November 2006 NEAIR -- The Changing Demographics of Higher Education
Tomás Rivera Study18-24 year old California Latinos • Almost 25% thought loan availability was contingent on grades • 30% would use a commercial bank as the source of their loan (Aspire) “Perceptions of College Financial Aid Among California Latino Youth” November 2006 NEAIR -- The Changing Demographics of Higher Education
Implications • Explaining the benefits of higher education will continue to be a challenge, especially when recruiting students with no family history • Opportunity costs are an impediment to many families • Cost perceptions will continue to hamper colleges ability to recruit • Need to better explain financial aid eligibility November 2006 NEAIR -- The Changing Demographics of Higher Education
White, Non-Hispanic Degree Attainment November 2006 NEAIR -- The Changing Demographics of Higher Education
PhD’s Awarded by Race November 2006 NEAIR -- The Changing Demographics of Higher Education
Master’s Degrees Awarded by Race November 2006 NEAIR -- The Changing Demographics of Higher Education
Bachelor’s Degrees Awarded by Race November 2006 NEAIR -- The Changing Demographics of Higher Education
Associate’s Degrees Awarded by Race November 2006 NEAIR -- The Changing Demographics of Higher Education
PhD’s Awarded by Race November 2006 NEAIR -- The Changing Demographics of Higher Education
College Continuation Rates November 2006 NEAIR -- The Changing Demographics of Higher Education
Fall 2005 Freshmen Enrollment by Race – Four-Year Colleges (CIRP) November 2006 NEAIR -- The Changing Demographics of Higher Education
NE HS Graduates: Changes in actual numbers from 2006 to 2018 November 2006 NEAIR -- The Changing Demographics of Higher Education
Northeast HS Graduates: Changes in actual numbers from 2006-07 to 2017-18 November 2006 NEAIR -- The Changing Demographics of Higher Education
Changes in HS Graduates in the Northeast: 2006-07 to 2017-2018 November 2006 NEAIR -- The Changing Demographics of Higher Education
HS Graduates in New England November 2006 NEAIR -- The Changing Demographics of Higher Education
SAT Takers by Race/Ethnicity November 2006 NEAIR -- The Changing Demographics of Higher Education
Participation by Low-income • All New England states above the national average of 25% • Lowest rates are in the south and west November 2006 NEAIR -- The Changing Demographics of Higher Education
HS Graduates in Massachusetts November 2006 NEAIR -- The Changing Demographics of Higher Education
Projections of HS Graduates in Vermont: 2006-07 to 2017-18 November 2006 NEAIR -- The Changing Demographics of Higher Education
HS Graduates in NH: 2006-07 to 2017-18 November 2006 NEAIR -- The Changing Demographics of Higher Education
HS Graduates in Massachusetts: 2006-07 to 2017-18 November 2006 NEAIR -- The Changing Demographics of Higher Education
HS Graduates in Connecticut November 2006 NEAIR -- The Changing Demographics of Higher Education
HS Graduates in NJ: 2006-07 to 2017-18 November 2006 NEAIR -- The Changing Demographics of Higher Education
HS Graduates in Maryland: 2006-07 to 2017-18 November 2006 NEAIR -- The Changing Demographics of Higher Education
HS Graduates in Pennsylvania: 2006-07 to 2017-18 November 2006 NEAIR -- The Changing Demographics of Higher Education