Download
1 / 42
420 likes | 507 Views
Library analytics U nderstanding impact and value. Graham Stone Information Resources Manager. #lidp #jiscLAMP http://eprints.hud.ac.uk/19669. This work is licensed under a Creative Commons Attribution 3.0 Unported License. Library Data at Huddersfield. Using Usage Data since 2005….

E N D
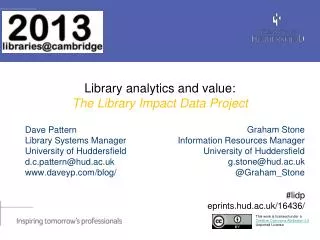
Library analyticsUnderstanding impact and value Graham Stone Information Resources Manager #lidp #jiscLAMP http://eprints.hud.ac.uk/19669 This work is licensed under a Creative Commons Attribution 3.0 Unported License
Using Usage Data since 2005… …to improve existing services …to gain insights into user behaviour …to measure the impact of the library
To support the hypothesis that… “There is a statistically significant correlation across a number of universities between library activity data and student attainment”
Library Impact Data Project 1Original data requirements • For each student who graduated in a given year, the following data was required: • Final grade achieved • Number of books borrowed • Number of times e-resources were accessed • Number of times each student entered the library, e.g. via a turnstile system that requires identity card access • School/Faculty
Library Impact Data ProjectPhase I • Showed a statistical significance between: • Final grade achieved • Number of books borrowed • Number of times e-resources were accessed • Across all 8 partners Not a cause and effect relationship
Library Impact Data Project Phase I looked at over 33,000 students across 8 universities Phase II looked at around 2,000 FT undergraduate students at Huddersfield
Library Impact Data Project 2Additional data • Demographics • Discipline • Retention • On/off campus use • Breadth and depth of e-resource usage • UCAS points (entry data) • Correlations for Phase 1
Library usageRetention Looking at one year of data for every student Using a cumulative measure of usage for the first two terms of the 2010-11 academic year Only looking at people who dropped out in term three All the students included in this study were at the university in the first two terms, and they have all had exactly the same opportunity to accumulate usage.
Other factorsNumber of e-resources accessed Both borrowing books and logging onto electronic resources does not guarantee the item has been read, understood and referenced Heavy usage does not equate to high information seeking or academic skills Additionally, students on particular courses may be using more primary materials only available outside of library resources: non-use of library resources does not mean students are using poor quality information
Adding valueInitial results • Rank entry points and final grade as percentage • Does the difference correlate with measures of usage? • WARNING! This needs further testing! • Methods are untried • Missing data • Initial results were very encouraging
Going forward@Huddersfield Thanks to Lee O’Farrell, University College Dublin, for the inspiration for this image Identifying retention issues and our impact on lowering them as part of a University dashboard
Going forward@Huddersfield • Two spin off projects • Lemon Tree • Roving Librarian • Look at specific subjects in order to work towards: • A best practice toolkit for information skills sessions • Further understanding by holding focus groups with target areas • Create an action plan to engage with academic colleagues • Showing value for money and the impact of the service on the student experience
Library Analytics Survey With thanks to the team at MIMAS for the initial survey analysis We asked: How important will analytics be to academic libraries now and in the future, and what is the potential for a service in this area?
How important will analytics be to academic libraries • Significant appetite for analytics services among this sample • 96% were interested in the automated provision of analytics demonstrating the relationship between student attainment and library usage • Strong willingness to share a broad range of data • preference to be identified by JISC band (91%) • as opposed to named institution (47%)
Key strategic drivers • Enhancing the student experience • Demonstrating value for money • Supporting research excellence
JiscLAMPLibrary Analytics and Metrics Project • Looking at the benefits of scale • To develop a prototype shared library analytics service for UK academic libraries • Envisioned as a data dashboard • Enabling libraries to capitalise on the many types of data they capture in day-to-day activities • To support the improvement and development of new services and demonstrate value and impact in new ways across the institution
JiscLAMPA brief word on ethics • Should we be holding and analyzing this kind of data • Data protection issues • ‘Big brother’ • All students pay the same fees – shouldn’t they be treated the same? • But what if we didn’t do this • What would the reaction be if it was found that we had this data but didn’t act on it? • We have a duty to care for the individual wellbeing of our students
The epic user storiesConsulting with the community • inform / justify library policy and decisions as evidence led • engage stakeholders in productive dialogue • identify basket of measures covering all key areas • inform librarian professional development • enable the sector to understand the questions to be answered connect the library with the university mission contribute to the institutional analytics effort demonstrate value added to users ensure value from major investments develop investment business cases impact student measures of satisfaction, such as NSS address measures of equality and diversity of opportunity
JiscLAMPWhat did we achieve? • LAMP project outputs • We managed to clean up and process the data from all of the partners • We created a prototype – our analytics engine • We performed a benchmarking exercise • We showed that the idea of a shared library analytics service was feasible
JiscLAMPWhat can we do with the data? • We can demonstrate usage by cohorts: DepartmentDegree nameCourseCourse ‘type’?Gender/Ethnicity/Nationality/Disability/AgeLevel of attainmentAttendance mode (full time/part time)UCAS points • We can demonstrate correlations between usage and attainment/usage and cohort)
JiscLAMPWhere do we go from here? • LAMP Phase 2 • We have funding for Phase 2 • We started testing the ‘ugly’ prototype yesterday! • Next steps include putting a project plan together
The initial prototypePrioritizing user stories • Merge data from multiple systems • Library, student registry, IT services • Contribute to the institutional analytics mission • Avoid data and reporting silos, e.g., spreadsheets and reports • Compelling visualisations • Map e-resource usage to actual users • Key usage indicators by discipline • Examine events by specific user groupings • e.g., overseas, distance
Other issues to addressFuture prototype functionality? • ‘High value’ users stories • Access to raw data • Correlate NSS scores, enquiries and collection strength • Correlate reading lists with actual usage • Wider issues • How do library analytics fit in with the SCONUL return • Triangulate usage with cost and license terms (JUSP/KB+) • Understand the patterns of e-resource use (JUSP/Raptor) • Inform decisions about relegation/relocation/weeding of stock (Copac Collection Management) • Assess shared collection potential including overlaps; benchmark collections against others (Copac Collection Management)
JiscLAMPPhase II • Workshop with SCONUL (London 7 May 2014) • engaging the wider library community, specifically library directors • Key contacts/relationships for next phase • HESA (NSS) • Shibboleth/Athens • SCONUL (performance group) • Business case ideas • Possibility of a LAMP service which provides consultancy whereby institutions could buy-in the analysis of data that they want
Thank you!http://jisclamp.mimas.ac.uk Graham Stone g.stone@hud.ac.uk #lidp #jiscLAMP http://eprints.hud.ac.uk/19669 This work is licensed under a Creative Commons Attribution 3.0 Unported License