Download
1 / 2
20 likes | 197 Views
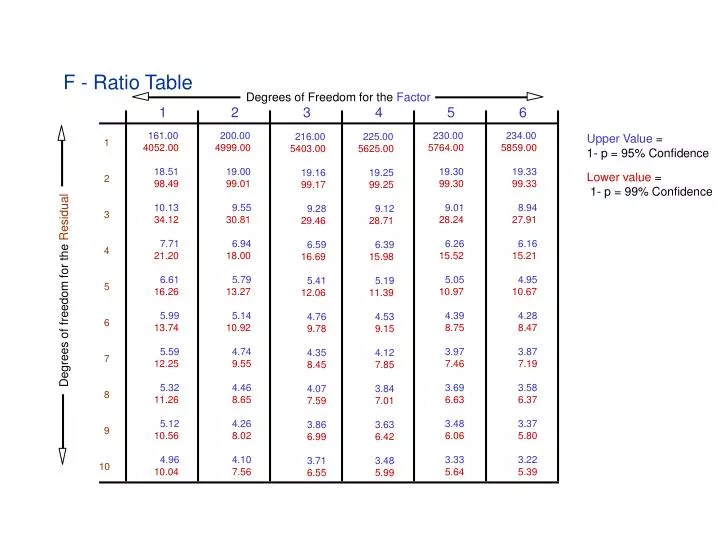
Upper Value = 1- p = 95% Confidence. Lower value = 1- p = 99% Confidence. Degrees of freedom for the Residual. F - Ratio Table. Degrees of Freedom for the Factor. 1. 2. 3. 4. 5. 6. 161.00. 200.00. 230.00. 234.00. 216.00. 225.00. 1. 4052.00. 4999.00. 5764.00. 5859.00.

E N D
Upper Value = 1- p = 95% Confidence Lower value = 1- p = 99% Confidence Degrees of freedom for the Residual F - Ratio Table Degrees of Freedom for the Factor 1 2 3 4 5 6 161.00 200.00 230.00 234.00 216.00 225.00 1 4052.00 4999.00 5764.00 5859.00 5403.00 5625.00 18.51 19.00 19.30 19.33 19.16 19.25 2 98.49 99.01 99.30 99.33 99.17 99.25 10.13 9.55 9.01 8.94 9.28 9.12 3 34.12 30.81 28.24 27.91 29.46 28.71 7.71 6.94 6.26 6.16 6.59 6.39 4 21.20 18.00 15.52 15.21 16.69 15.98 6.61 5.79 5.05 4.95 5.41 5.19 5 16.26 13.27 10.97 10.67 12.06 11.39 5.99 5.14 4.39 4.28 4.76 4.53 6 13.74 10.92 8.75 8.47 9.78 9.15 5.59 4.74 3.97 3.87 4.35 4.12 7 12.25 9.55 7.46 7.19 8.45 7.85 5.32 4.46 3.69 3.58 4.07 3.84 8 11.26 8.65 6.63 6.37 7.59 7.01 5.12 4.26 3.48 3.37 3.86 3.63 9 10.56 8.02 6.06 5.80 6.99 6.42 4.96 4.10 3.33 3.22 3.71 3.48 10 10.04 7.56 5.64 5.39 6.55 5.99
Upper Value = 1- p = 95% Confidence Lower value = 1- p = 99% Confidence Degrees of freedom for the Residual o o F - Ratio Table Degrees of Freedom for the Factor 1 2 3 4 5 6 4.54 3.68 2.90 2.79 3.29 3.06 15 8.68 6.36 4.56 4.32 5.42 4.89 4.35 3.49 2.71 2.60 3.10 2.87 20 8.10 5.85 4.10 3.87 4.94 4.43 4.24 3.38 2.60 2.49 2.99 2.76 25 7.77 5.57 3.86 3.63 4.68 4.18 4.17 3.32 2.53 2.42 2.92 2.69 30 7.56 5.39 3.70 3.47 4.51 4.02 4.08 3.23 2.45 2.34 2.84 2.61 40 7.31 5.18 3.51 3.29 4.31 3.83 4.03 3.18 2.40 2.29 2.79 2.56 50 7.17 5.06 3.41 3.18 4.20 3.72 3.94 3.09 2.30 2.19 2.70 2.46 100 6.90 4.82 3.20 2.99 3.98 3.51 3.86 3.02 2.23 2.12 2.62 2.39 400 6.70 4.66 3.06 2.85 3.83 3.36 3.85 3.00 2.22 2.10 2.61 2.38 1000 6.66 4.62 3.04 2.82 3.80 3.34 3.84 2.99 2.21 2.09 2.60 3.78 2.37 3.32 6.64 4.60 3.02 2.80