Download
1 / 23
230 likes | 328 Views
Ranking Interesting Subgroups. Stefan Rüping Fraunhofer IAIS stefan.rueping@iais.fraunhofer.de. Motivation. name_score >= 1 & geoscore >= 1 & housing >= 5 p = 41.6% Income_score >= 5 & name_score >= 5 & housing >= 5 p = 36.0%

E N D
Ranking Interesting Subgroups Stefan Rüping Fraunhofer IAIS stefan.rueping@iais.fraunhofer.de
Motivation name_score >= 1 &geoscore >= 1 & housing >= 5 p = 41.6% Income_score >= 5 & name_score >= 5 & housing >= 5 p = 36.0% Active_housholds >= 3 & queries_per_household >= 1 &housing >= 5 p = 43.8% Families == 0 &name_score >= 1 & housing == 0 p = 28.9% Financial_status == 0 &name_score >= 3 &housing <= 5 p = 66.1%
Motivation name_score >= 1 &geoscore >= 1 & housing >= 5 p = 41.6% Income_score >= 5 & name_score >= 5 & housing >= 5 p = 36.0% Active_housholds >= 3 & queries_per_household >= 1 &housing >= 5 p = 43.8% Families == 0 &name_score >= 1 & housing == 0 p = 28.9% Financial_status == 0 &name_score >= 3 &housing <= 5 p = 66.1%
Motivation name_score >= 1 &geoscore >= 1 & housing >= 5 p = 41.6% Income_score >= 5 & name_score >= 5 & housing >= 5 p = 36.0% Active_housholds >= 3 & queries_per_household >= 1 &housing >= 5 p = 43.8% Families == 0 &name_score >= 1 & housing == 0 p = 28.9% Financial_status == 0 &name_score >= 3 &housing <= 5 p = 66.1% • Applying ranking to complex data: subgroup models • Optimization of data mining models for non-expert users
Overview • Introduction to Subgroup Discovery • Interesting Patterns • Ranking Subgroups • Representation • Ranking SVMs • Iterative algorithm • Experiments • Conclusions
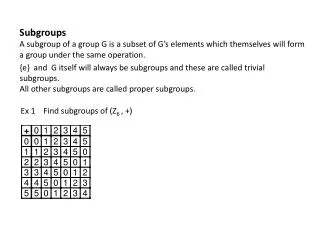
Subgroup Discovery • Input • X defined by nominal attributes A1,…,Ad • Data • Subgroup language • Propositional formula Ai1 = vj1 Ai2 = vj2 … • For a subgroup S let • g(S) = #{ xi S }/n, p(S) = #{ xi S | yi = 1 }/g(S), p0 = |yi = 1|/n • q(S) = g(S)a (p(S)-p0) • Task • Find k subgroups with highest significance (maximal quality q) Subgroupsizeandclassprobability a = 0.5 t-testSubgroupquality = significanceofpattern
Subgroup Discovery: Example S1: Weather = good sales = high g(S) = 4/8 p(S) = 4/4 q(S) = (4/8)0.5 (4/4 - 5/8) = 0.265
Subgroup Discovery: Example S1: Weather = good sales = high g(S) = 4/8 p(S) = 4/4 q(S) = (4/8)0.5 (4/4 - 5/8) = 0.265 S2: Advertised = yes sales = high g(s) = 2/8 p(S) = 2/2 q(S) = (2/8)0.5 (2/2 – 5/8) = 0.187
Subgroup Discovery: Example S1: Weather = good sales = high g(S) = 4/8 p(S) = 4/4 q(S) = (4/8)0.5 (4/4 - 5/8) = 0.265 S2: Advertised = yes sales = high g(s) = 2/8 p(S) = 2/2 q(S) = (2/8)0.5 (2/2 – 5/8) = 0.187 Significance≠ Interestingness
Interesting Patterns What makes a pattern interesting to the user? Depends on prior knowledge, but heuristics exist • Attributes • Actionability • Acquaintedness • Sub-space • Novelty • Complexity • Not too complex • Not too simple ?
Overview: Ranking Interesting Subgroups „S1 > S2“ Data SubgroupDiscovery Task Modification Ranking SVM SubgroupRepresentation
Subgroup Representation (1/3) • Subgroups become examples of ranking learner! • Notation • Ai = original attribute • r(S) = representation of subgroup S • Remember: important properties of subgroups • Attributes • Examples • Complexity • Representing complexity • r(S) includes g(S) andp(S)-p0
Subgroup Representation (2/3) Representing attributes • For each attribute Ai of the original examples include into subgroup representation attribute • Observation: TF/IDF-like representation performs even better
Subgroup Representation (3/3) Representing examples • User may be more interested in subset of examples • Construct list of known relevant and irrelevant subgroups from user feedback • For each subgroup S and each known relevant/irrelevant subgroup T define relatedness of S to known subgroup T
Ranking Optimization Problem • Rationale • Subgroup discovery gives quality q(S) = g(S)a (p(S)-p0) • User defines ranking by pairs „S1 > S2“ (S1 is better than S2) • Find true ranking q* such that S1 > S2 <=> q*(S1) > q*(S2) • Assumption (justfied by assuming hidden labels of interestingness of examples) • Define linear ranking function log q*(S) = (a,1,w) r(S)
Ranking Optimization Problem (2/2) • Solution similar to ranking SVM • Optimization problem: • Equivalent problem: where z = r(Si,1)-r(Si,2). Remember log q*(S) = (a,1,w) r(S)
Ranking Optimization Problem (2/2) Deviation fromparameter a0 in subgroupdiscovery • Solution similar to ranking SVM • Optimization problem: • Equivalent problem: where z = r(Si,1)-r(Si,2). Remember log q*(S) = (a,1,w) r(S)
Ranking Optimization Problem (2/2) Deviation fromparameter a0 in subgroupdiscovery • Solution similar to ranking SVM • Optimization problem: • Equivalent problem: where z = r(Si,1)-r(Si,2). Remember log q*(S) = (a,1,w) r(S) Constant weightfor g(S) definesmargin
Iterative Procedure subgrouprankingsearch • Why? • Google: ~1012 web pages • Same number of possible subgroups on 12-dimensional data set with 9 distinct values per attribute • cannot compute all subgroups for single-step ranking • Approach • Optimization problem gives new estimate of a • Transform weight of subgroups–features into weights for original examples • Idea: replace binary y with numeric value. Appropriate offset guarantees that subgroup-q is approximates optimized q*
Experiments • Simulation on UCI data • Replace true label with most correlated attribute • Use true label to simulate user • Measure correspondence of algorithm‘s ranking with subgroups found on true label • Tests ability of approach to flexibly adapt to correlated patterns • Performance measure • Area under the curve – retrieval of true top 100 subgroups • Kendall‘s - internal consistency of returned ranking
Results • Wilcoxon signed rank test confirms significance • 3 Data sets with minimal AUC are exactly the ones with minimal correlation between true and proxy label!
Conclusions • Example of ranking on complex, knowledge-rich data • Interestingness of subgroups patterns can be significantly increased with interactive ranking-based method • Step toward automating machine learning for end-users • Future work: • Validation with true users • Active learning approach