Download

1 / 27
280 likes | 393 Views
IRP Presentation. Advisor / Clients: Dr. James McCalley Venkat Krishnan Joseph Slegers Team Members: Michael Healy (EE), Deogratius Mpinge (CprE), Spenser Mussmann (EE), and Abdelmagid Yousif (EE) Team ID: Dec11_06.

E N D
IRP Presentation Advisor / Clients: Dr. James McCalley Venkat Krishnan Joseph Slegers Team Members: Michael Healy (EE), Deogratius Mpinge (CprE), Spenser Mussmann (EE), and Abdelmagid Yousif (EE) Team ID: Dec11_06 Modeling Energy System Investment Planning Infrastructure for the State of Iowa
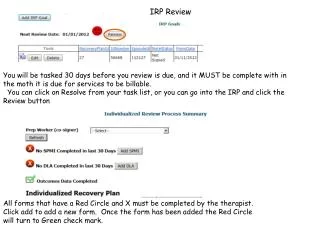
Problem Statement The energy and transportation demands continue to rise across the state of Iowa. An investment plan will need to be created for the next several decades to meet these demands and remain economical. The goal of this project is to accurately describe, in a data set, the current energy and transportation sectors within the state of Iowa. This data set will be analyzed by NETPLAN, Iowa State University software, and the results will describe investment strategies as well as emission, un-served demands, capacities, arc flows, and system resiliency. These results will be displayed on a public website. The current system as well as other scenarios will be available to the user to demonstrate different investment strategies available.
Project Plan • Software analysis: • NEMS – Electric infrastructure • MARKAL/TIMES – Electric infrastructure • CARVER2 – Transportation infrastructure • TRAGIS – Transportation infrastructure • NETPLAN – Relationship between electric and transportation
Project Plan • 1. Collect Required Data for NETPLAN • Generation • Type • Capacity • Specifications • Transmission • Size • Capacity • Specifications • Transportation • Passenger • Commodity
Project Plan • 2. Develop Website • Google Earth • Provide infrastructure information • Visual depiction of current infrastructure • Results/Documentation • Dynamic • Easy to access • Easy to understand • Easy to navigate
Project Plan • 3. Base Case and Scenario Creation • Base Case • Describes current infrastructure • Benchmark for all other scenarios • Alternative Cases • - Accounts for potential technological improvements or government intervention
Project Plan • 4. Create a guide and improve NETPLAN user manual • Guide • Step-by-step description of our data set • Provides guidance for next research team • User manual updates • Description of all files • Hints/tips we learned along the way
Project Plan • Schedule • Task Breakdown • Task Schedule
Project Design • Data Set • Node system • Generation • At least 95% of total generation • Cut off limit • Demand • Locations • Compensation
Project Design • Data Set (cont.) • Arc system • Transmission Lines • Size • Routes • Transportation Routes • Type • Emissions • Fuel Routes • Natural gas pipelines • Fuel by rail • Fuel by vehicle
Project Design • 2. Developing the Website • Google Earth Map • Contains node map • Generation sites • Transmission lines • Transportation routes • Wind maps • Natural gas pipelines/storage sites
Project Design • 2. Developing the Website (Cont.) • All project documentation • Interactive NETPLAN results • Tables • Charts • Downloadable content • References/contact information • Instructions on running NETPLAN from home
Project Implementation • 1. Investment Strategies • Data Set • Formulation of base case • Formulation of alternative scenarios • NETPLAN • Interface Results • Result files • Results displayed on website
Project Implementation 1. Investment Strategies (Cont.) • Data Set to NETPLAN • NETPLAN results stored as tables and charts • Results to website
Project Implementation 2. Google Earth Map Acquire all needed infrastructures data for electric and transportation sectors Use the geographical coordination to build KML files ( Keyhole Markup Language) in Google Earth Add the basic information (owner, size, length,…etc) for each unit to KML files Implement the KML files on the website using HTML and Java script languages Coordinate HTML & Java Script Owner, size, length…etc Data KML file Website
Project Implementation 2. Google Earth Map (Cont.)
Project Implementation 3. User Interface • Google Earth Interface • Java script and HTML code • Allows user to specify which infrastructure component to view • User can view multiple components at a time (Wind speed maps and wind farm locations) • NETPLAN Results Interface • Java script and HTML code • 21 different scenarios available • User can view the results on the website or download them
Testing and Evaluation • Test the functionality of the website to ensure all the requirements are met • Analyze and evaluate the base case result to ensure it is reasonable and accurate • Develop scenarios to compare with base case on the future energy and transportation needs • Evaluate each scenario for violations
Base Case • Assumptions • Generation Investment Costs • Transportation Investment Costs • Lifespan • Current Fuel Price • Average Annual Demand • Annual Peak Demand • Emission Rates • Investment Limits • Investment Locations
Base Case • Results • High wind and natural gas generation investments • High wind potential led to feasibility of hybrid vehicles • Emissions per GW dropped significantly • The total capacity of Iowa increased from approximately 12 GW to 30 GW
Base Case Results (Cont.)
High Wind Investment Scenario Clarification: The total wind capacity we found was for use in Iowa only. If we consider the potential export of energy this number will be much higher. This scenario represents a possible investment strategy Iowa could undertake. There have been many improvements to wind turbine technology, and this case accounts for increased capacity factor. We found similar results to that of the base case, however wind investments now covered the capacity of the initial coal investments. Hybrid vehicles became more feasible since more energy was being generated without an increase in generation sites. We assumed existing and new capacity factors would increase by approximately 15%.
Conclusion • Wind is able to provide the most needed energy for the future with the best economical and environmental solution • Increase the wind turbine efficiency considered as the best solution than other wind scenarios • Investment in wind will also require investment in natural gas • According to our analysis, hybrid vehicles should become economically feasible sometime during the next 40 years
Future Work • Develop and Improve NETPLAN software • Simulation time • End of lifespan function • Running NETPLAN from the website • Simulation time • Access to CPLEX
Special Thanks • Dr. James McCalley, advisor • Venkat Krishnan, PhD graduate student • Joseph Slegers, MS graduates student • Eduardo Eibanez, ISU PhD graduate • NETSCORE21 Team
Questions ? Senior Design Team Website: http://seniord.ece.iastate.edu/dec1106