Download
1 / 33
330 likes | 425 Views
GIS Basics. Listening Sessions Wisconsin Geographic Information Coordination Council (WIGICC). Credits

E N D
GIS Basics Listening Sessions Wisconsin Geographic Information Coordination Council (WIGICC) Credits Bay-Lake Regional Planning Commission, City of Green Bay, ESRI, Google, Milwaukee Public Schools, US Census Bureau, USDA-FSA, USGS, University of Arizona,UWEX,UW-Fox Valley, WDATCP, WDNR, WGNHS
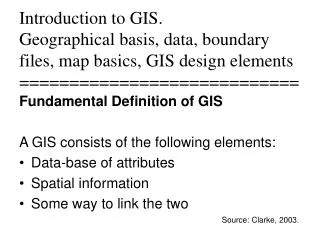
Geography is… • Information about the earth’s surface and things on it (which we all share) • Framework for organizing data • Science behind GIS Geography matters to all of us!
GIS is… • Geographic Information System • Technology to create, visualize, integrate, and analyze data from a geographic perspective • Automated tool for making maps
GIS is… • Process for creating information relevant to decisions made by people and organizations • System that supports program and resource planning, inventory, management, and evaluation activities
View, interpret and understand data in ways not possible with other tools! Dairy Farms A picture is worth… a thousand rows of data!
GIS is used to… • Facilitate communication • Promote coordination • Solve problems • Measure resources • Make decisions • Understand past and present situations • Anticipate future scenarios
GIS is a way to model our world! Events Zoning Streets Utilities Ownership Natural Resources Real World
The process of GIS… • Think about a place or topic… • Ask a question about it… • Make a map… • Explore patterns that appear… • Try different analyses… • Ask a new question… • Repeat…
Maps that tell a story… • Where is ____? • How many ____? • Density of ____? • What’s inside ____? • What’s near ____? • How has ____ changed? • How do ____ relate? • What if?
Where is ____? • Find places and features • Determine optimum routes • Calculate driving time • Efficiently plan site visits • Define service areas • Find patterns • See where to take action
Where is ____? All of us have used a map to figure out where “it” is and how to get there.
Where is ____? GIS helps us identify the best responder and best route in emergency situations.
Earthquake hazard maps are essential for creating and updating building codes. earthquake.usgs.gov Where is ____? Patterns emerge when you look at the distribution of features.
Where is ____? Orthophotography helps us visualize where we are in relation to other features.
How many ____? • Mapping the quantity of features by area helps us • find places that meet specific criteria • see relationships between places • More information than simply mapping the locations of features • Prioritize and manage actions based on the “most” or “least”
U.S. Census Bureau American FactFinder websitehttp://factfinder.census.gov How many ____? Percent of vacant housing units in Conover, WI
Density of ____? • Map concentrations of features by location • Measure the number of features using a uniform area measurement unit to clearly see the distribution • Per acre or square mile • Prioritize and manage actions based on density
Density of ____? Deer Population Density Wisconsin DNR
What’s inside ____? • What's happening inside or outside an area • Prioritize and manage actions within an area • Example • Apply stiffer penalties to drug-related arrests within 1,000 feet of a school
What’s inside ____? Green Bay city ordinance uses buffer zones around places where children are likely to congregate.
What’s inside ____? If you were moving to Milwaukee, WI, you might want to know which neighborhood your home falls within.
What’s near ____? • Map what's located or occurring within a set distance of a feature • Prioritize and manage actions around a feature • Example • Identify and sample livestock within a 5-mile radius of an infected animal
What’s near ____? Find the closest ATM location to the restaurant you’re eating in before the bill arrives!
What’s near ____? Critical facilities exposed to flood risk in Sheboygan County, WI
How has ____ changed? • Evaluate results of an action or policy • Gain insight into how things behave over time • Anticipate future needs • Map conditions before and after an action or event to see the impact • Decide on a course of action based on future considerations
How has ____ changed? Land cover change 1992 to 2001
How do ____ relate? • Overlay and analyze data that can only be combined by location or area • Integrate information • Develop models • See in 3-D • Decide on a course of action based on spatial analyses
How do ____ relate? • This groundwater contamination susceptibility model integrates: • - Bedrock depth • Bedrock type • Soil characteristics • Surface deposits • Water table depth
What if? • Integrate data from different sources to develop “what if” scenarios
Red areas of southern Florida are susceptible to a five-meter rise of sea level, based on elevation. Yellow denotes urban areas. What if? What if the Greenland Ice Sheet melts?
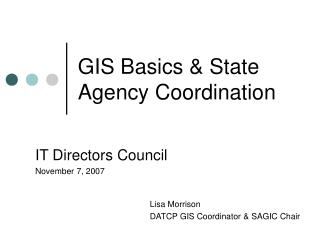
GIS Coordination • Cross-jurisdictional and cross-functional sharing of data is crucial, especially in emergency situations • Does the data exist? • Who has it? • How can I access it? • How useful is it for my need (quality, completeness, scale, age, attributes)? • Can I easily integrate it with other data?
GIS Coordination • Public expects and deserves efficient and effective services • Number of people using location-based technologies continues to increase (e.g., GIS, GPS, Web Maps)
Questions? Thanks for your participation!