Download
1 / 32
330 likes | 545 Views
Vital Statistics of Populations. Vital Statistics of Populations. Natural selection recognizes only one currency: Even though individuals are selected to maximize LRS, they may go about it very differently. successful offspring. Evolution of Reproductive Tactics.

E N D
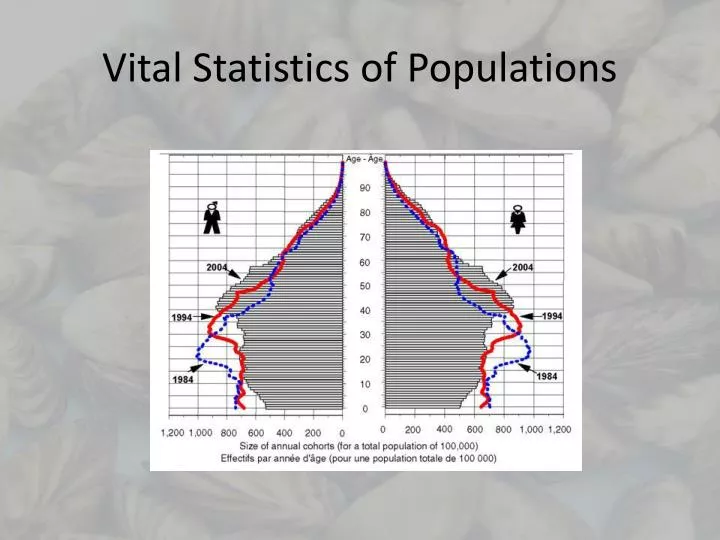
Vital Statistics of Populations • Natural selection recognizes only one currency: • Even though individuals are selected to maximize LRS, they may go about it very differently successful offspring
Evolution of Reproductive Tactics • Some, most annual plants, many insects and certain fish, reproduce only once in their lifetime • Many other species, including perennial plants and most vertebrates practice semelparous iteroparous
Evolution of Reproductive Tactics • Furthermore, the number of offspring vary tremendously: e.g. seeds may be in the 100’s or millions (acorns) • Even within a single species, there may be a wide variation in reproductive strategy (e.g. when stressed, poppies may produce as few as 4 seeds vs. 1/3 M when conditions favorable) • Other groups as well (fish, lizards)
Evolution of Reproductive Tactics • Remember, given the likelihood of death, it is always better to reproduce earlier than later (all else being equal) • However, many postpone reproduction (e.g. agave, seabirds, fish)
Evolution of Reproductive Tactics • High fecundity early in life is often correlated with decreased fertility later (fig 8.10) • How do so many tactics persist within a single species?
Reproductive Effort • How much should an organism invest in any given act of reproduction?
Reproductive Effort • “it would be instructive to know not only by what physiological mechanism a just apportionment is made between the nutriment devoted to the gonads and that devoted to the rest of the parental organism, but also what circumstances in the life history and environment would render profitable the diversion of a greater or lesser share of the available resources towards reproduction” R.A. Fisher (1930)
Reproductive Effort • Fisher already had distinguished between the proximate factor (physiological) and the ultimate factors (LH & enviro) that determine the allocation of resources best suited for reproductive (termed reproductive effort) and non-reproductive activities
Reproductive Effort • Among different plant species, energy expenditure on reproduction ranges from near 0% to 40% (over a lifetime) • Annuals tend to spend proportionately more than perennials in reproduction • Clearly other factors are important (e.g. consider plants in varying densities and how they may vary their investments)
Reproductive Effort • There are trade-offs: increased RE may also cost by reducing survivorship of the soma (extremely displayed by semelparous individuals) • More subtle exchanges are typical
Reproductive Effort • This can be typified by the concept of residual reproductive value (pg. 146), which is simply age-specific expectation of all future offspring beyond those immediately at stake • E.g. an individual with greater potential future RS should be more risk adverse than one with low future potential RS
Reproductive Effort • For any given curve of possible tactics, all other tactics yield lower returns in LRS • Note: concave-upward curves result in semelparity, convex result in iteroparity as numbers are maximized at intermediate current level of reproduction
Reproductive Effort • Possible trade-offs between immediate reproduction and future reproductive success over the lifetime of an iteroparous organism are depicted in fig. 8.13
Reproductive Effort • Similar plot for a semelparous organism;
Expenditure per Progeny • Not all offspring are created equal!! • Progeny produced late in the growing season often have lower probabilities of reaching adulthood than those produced earlier • Likewise, larger offspring may usually cost more to produce, but are ‘worth more’ as they may increase the probability of reaching adulthood r-K selection
Expenditure per Progeny • Line A represents the unlikely event that progeny fitness increases linearly with parental expenditure • If progeny fitness increases sigmoidally with PI, there would be an optimal clutch size • Note difference (parent/offspring)
Expenditure per Progeny • A simple graphical model illustrates this trade-off between quality and quantity • Note: fitness of individual progeny decreases with increasing clutch/litter size • If parental fitness is flat (no optimal clutch size; line A) • Again if sigmoidal, then optimal clutch size exists
Expenditure per Progeny • Can you think of why an optimal clutch size may exist?
Patterns in Avian Clutch Size • Birds vary widely in the clutch sizes (e.g. penguins, albatrosses, doves, hummers all have 1 or 2) compared to some waterfowl (20+) • Another component interwoven with clutch size is offspring quality (altricial vs. precocial)
Patterns in Avian Clutch Size • Another dichotomy among birds is determinate and indeterminate layers
Patterns in Avian Clutch Size • Young birds from a large clutch typically leave the nest at a lighter weight
Patterns in Avian Clutch Size • In addition, optimal clutch not only varies with ‘future reproductive potential’ but environmental conditions
Patterns in Avian Clutch Size • In the European starling, clutch size varies from 2 to 8 with modal clutch size is 4 or 5, varying seasonally • Although the number of young fledged varies, due to high juvenile mortality, larger clutches do NOT return more young
Patterns in Avian Clutch Size • Clutch size in chimney swifts varies from 1 to 3 with differential mortality occurring in the nest • Typically 2 survive in sunny years and 1 in cloudy years
Patterns in Avian Clutch Size • Low reproductive rate of most seabirds caused Wynne-Edwards (1962) to interpret this behavior as one in which individuals are simply trying to replace themselves and not diminish common resources • Group selection
Patterns in Avian Clutch Size • Within a single species, we often see a latitudinal gradient in reproductive strategies (clutch size)
Patterns in Avian Clutch Size • Daylength hypothesis • Prey diversity hypothesis • Spring bloom (or competition) hypothesis • Nest predation hypothesis • Hazards of migration (residual RV) hypothesis