Download

1 / 8
80 likes | 99 Views
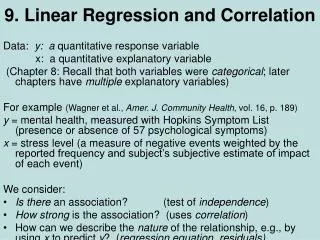
Explore the linear relationship between age and days backpacking. Perform regression test and calculate correlation coefficients. Utilize scatterplot and critical values to determine significance. Predict days based on age and interpret findings.

E N D
Linear Regression and Correlation Eight backpackers were asked their age (in years) and the number of days they backpacked on their last backpacking trip. Is there a linear relationship between the age of a backpacker and the number of days they backpack on one trip? Age # Days 20 17 40 8 34 8 40 10 58 7 50 7 26 12 70 3
Linear Regression and Correlation Age # Days 20 17 40 8 34 8 40 10 58 7 50 7 26 12 70 3 • First, do a scatterplot of the data, where age is the independent variable and # Days is the dependent variable. • Do the Linear Regression Hypothesis Test. Ho: ρ = 0 Ha: ρ ≠ 0
Linear Regression and Correlation • Calculator instructions: • Enter Age into L1 and # Days into L2. • Access LinRegTTest (STAT, TESTS, scroll to LinRegTTests) • Xlist is L1, Ylist is L2, Freq is 1, choose ≠, leave RegEQ blank, Calculate • The following will show on the calculator. • y=a + bx • t = -5.09 • p = 0.022 • df = 6 • a = 18.5286 • b = -0.2255 • s = 1.94 • r2 = 0.8112 (this is the coefficient of determination) • r = -0.901
Linear Regression and Correlation • Line of Best Fit or Least Squares Line yhat = a + bx: yhat = 18.5286 – 0.2255x Correlation: r = - 0.9011
Linear Regression and Correlation • Is the correlation, r, significant? (this is Method 1) • Because the pvalue = 0.0022 which is less than the assumed alpha of 0.05, we reject the Null Hypothesis. This means the correlation coefficient is significant and the line is a good fit. • We can plot the line and can use the line for prediction.
Linear Regression and Correlation • Is the correlation, r, significant? (this is Method 2) • Compare r = - 0.901 to the value in the 95% Critical Values of the Sample Correlation Coefficient Table at the end of chapter 12. • Since n – 2 = 8 – 2 = 6, the table critical value is – 0.707; negative r, use negative critical value. • Because -0.9011 < -0.707, r is significant. • We can plot the line and can use the line for prediction.
Linear Regression and Correlation TABLE 95% CRITICAL VALUES OF THE SAMPLE CORRELATION COEFFICIENT Degrees of Freedom: n - 2 Critical Values: (+ and -) 1 0.997 2 0.950 3 0.878 4 0.811 5 0.754 6 0.707 7 0.666 8 0.632 9 0.602 10 0.576
Linear Regression and Correlation • If age of backpacker = 45 years, how many days, on average, would he or she backpack? • yhat = 18.5286 – 0.2255(45) = 8.38 days • If age of backpacker = 32 years, how many days, on average, would he or she backpack? • yhat = 18.5286 – 0.2255(32) = 11.31 days • If age of backpacker = 90 years, how many days, on average, would he or she backpack? • yhat = 18.5286 – 0.2255(90) = -1.77 days • This answer makes no sense since 90 is outside the domain of the equation. (Reminder: 20 x 70)