Download
1 / 33
340 likes | 503 Views
When Signal Coordination Should Break According to Traffic Demand: A Case Study Sparks Blvd. Rasool Andalibian Zong Tian , PhD, P.E., University of Nevada, Reno June 2012. Outline. Background and Problem Statement Signal Coordination: Common Practice

E N D
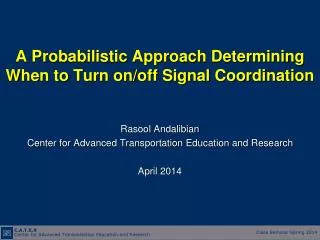
When Signal Coordination Should Break According to Traffic Demand: A Case Study Sparks Blvd Rasool Andalibian ZongTian, PhD, P.E., University of Nevada, Reno June 2012
Outline • Background and Problem Statement • Signal Coordination: Common Practice • Stop Probabilistic Model (non-coordinated arterials) • Simulation Evaluation • Summary and Conclusions
Problem Statement • Major signalized arterials are generally coordinated during peak periods. • They run free (actuated) during non-peak periods. • Traffic demand level is a key element to consider. • At what demand level signal coordination is warranted?
Signal Coordination Strategy • Signal Timing Manual: Establishing coordination is justifiable when the intersections are in close proximity of each other and there is a large amount of traffic on coordinated street. • MUTCD: Traffic signal within 0.5 mile of each other along a corridor should be coordinated. • FHWA: When intersections are close together (i.e., within ¾ mile of each other) it is advantageous to coordinate them. At greater distances (over ¾ mile), the traffic volumes and potential for platoons should be reviewed for coordination operation.
Research Objectives • Develop a probabilistic model that predicts the number of stops for non-coordinated signalized arterials. • Develop # stop thresholds using the model that can guide engineers to decide when signals should be coordinated or not. • Determining whens signal progression should break for Sparks Blvd pertaining to traffic demand.
Model Assumptions • Probability of stop at an intersection is independent from the other intersections. • Probability of stop is a function of the red time to cycle length ratio, r/c. • Vehicle arrivals are random. • Traffic is under-saturated.
Probabilistic Model: Basic Equations i i = direction of travel a = intersection index
Homogenous Probability Model • Probability of hitting green in direction i at each intersection is the same: • The probability of making x number of stops out of n intersections follows a Binomial distribution: • The expected number of stops:
Non-homogenous Probability Model • Probability of hitting green at each intersection is NOT the same: • The probability of making x number of stops out of n intersections: • The expected number of stops:
Simplified Non-homogenous • Non-homogenous case could be simplified to homogenous case using average g/c ratio: • Proof:
Model Validation: A Case Study • Sparks Blvd, Sparks, Nevada. • 4.5 mile length. • 9 intersections. • Speed limit 40 mph.
Demand Scenarios • Various demand scenarios were generated using midday traffic demand as the base. • Using HCM methodology to calculate v/c ratios. • Signals are set in free mode.
Timing Plan • Fully Actuated Mode • Min Recall on Sparks Blvd (Main Street) • Signal Timing Parameters: Current Parameters that have been Implemented in the field • Coordinated Plan, Based on Mid-Day Peak Hours
Proposed Model vs. VISSIM Simulation(Q-Q Plot) Using g/c ratio from HCM Using g/c ratio from Synchro
Proposed Model vs. VISSIM Simulation Using g/c ratio from Synchro Using g/c ratio from HCM
Signal Coordination Guideline • When number of stops is more than 50% in free mode, signals should be coordinated. In this case, two consecutive stops is guaranteed. • When number of stops is less than 20% in free mode, it means that the performance of the system is acceptable and no coordination. • When number of stops falls between 20% and 50%, engineering judgment should be applied to determine whether to run signals in coordination or not.
No. Stops: Coordinated vs. Free Mode NB Direction SB Direction 0.10 0.51 0.51 0.09
Summary and Findings • Lack of consistency in traffic demand level to determine when signalized arterials should be coordinated. • This study is to develop a probabilistic model that predicts #stops for non-coordinated signalized arterials and develop a guideline recommending when signals should be coordinated. • Number of stops is a function of g/c ratio which embeds v/c ratio indirectly. The higher the g/c the lower the chance of making stops.
Summary and Findings Cont. • The result of simulation model (comparing coordination and non-coordination plan) approves the recommended guideline for signal timing strategy. • Sparks Blvd: • When v/c is greater than 0.5 signals should be coordinated. • When v/c is less than 0.10 signals should be ran free. • When v/c falls between 0.10 and 0.50engineering judgment should be apply for signal timing strategy.
QUESTION THANK YOU
Numerical Example • A hypothetical arterial of five intersections with the following g/C ratios. Homogenous Case Non-Homogenous Case
Comparison Non-Homogenous Homogenous
Travel Time: Coordinated vs. Free Mode NB Direction SB Direction
Travel Time: Aggregated Model • Travel time difference:
Signal Coordination Guideline Eng. Judgment NO YES Coordination % Stops (Free Mode)
Proposed Model vs. VISSIM Simulation Using g/c ratio from HCM Using g/c ratio from Synchro
Simulation Results Coordination VS. NON_COORDINATION
Sparks Blvd: Coordination Plan • A coordinated plan for midday traffic condition. • The plan mainly favorites southbound direction. • The model ran 10 times for each scenario. • MOES: arterial travel time, side street delay & #stops.