Download
1 / 14
140 likes | 236 Views
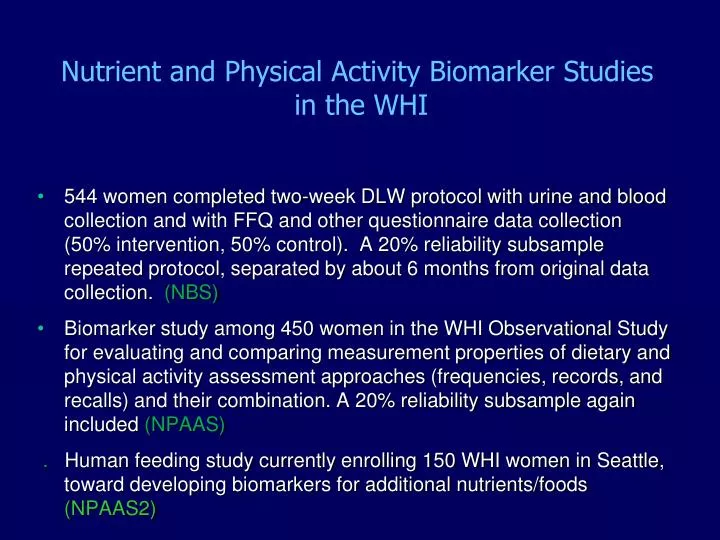
Nutrient and Physical Activity Biomarker Studies in the WHI.

E N D
Nutrient and Physical Activity Biomarker Studies in the WHI • 544 women completed two-week DLW protocol with urine and blood collection and with FFQ and other questionnaire data collection (50% intervention, 50% control). A 20% reliability subsample repeated protocol, separated by about 6 months from original data collection. (NBS) • Biomarker study among 450 women in the WHI Observational Study for evaluating and comparing measurement properties of dietary and physical activity assessment approaches (frequencies, records, and recalls) and their combination. A 20% reliability subsample again included (NPAAS) . Human feeding study currently enrolling 150 WHI women in Seattle, toward developing biomarkers for additional nutrients/foods (NPAAS2)
Acknowledgments NBS and NPAAS Coordinators: Marian Neuhouser, Lesley Tinker, FHCRC NBS and NPAAS Clinical Center PIs: Shirley Beresford - Seattle Judy Ockene - U Mass Bette Caan - Oakland Gerardo Heiss - UNC Linda Van Horn - Chicago Lewis Kuller* - Pittsburgh Cynthia Thomson - Arizona Marcia Stefanick* - Stanford Yasmin Mossavar-Rahmani† - NYC Ellen Smit* - Portland Karen Johnson - Memphis AnnlouiseAssaf* - Pawtucket Gloria Sarto - Wisconsin *NBS only †NPAAS only Biomarker PIs: Statistical Collaborators: Dale Schoeller - Wisconsin Pamela Shaw - NIAID Sheila Bingham - Cambridge Ying Huang – FHCRC NPAAS2-Johanna Lampe, Marian, Lesley,Shirley,…
Regression Calibration Coefficients for Log-Transformed Total Energy, Total Protein and Percent Energy from Protein (Neuhouser et al, AJE, 2008)
Geometric means and 95% confidence intervals for uncalibrated dietary intakes as estimated by the Women’s Health Initiative (WHI) Food Frequency Questionnaire, and for calibrated intakes using nutritional biomarker data in the WHI Dietary Modification trial comparison group (DM) and Observational Study (OS) (Prentice et al, AJE, 2009)
Body fat deposition and energy and protein associations with disease risk • Increase in body mass fat deposition (e.g. increased BMI) over time may be the principal mediator of energy and cancer, CVD, and diabetes associations. • But, analyses that include BMI in calibration equation but not in disease risk model require specialized methods (Prentice and Huang, 2011, Can J Stat) • NBS calibration equations also used for other purposes(e.g. protein in relation to both frailty and kidney function (Jeannette Beasley)
Calibration Equation Coefficients (β), Standard Errors (SE), and Percent of Biomarker Variation Explained (R2) from Regression of Log(biomarker) on Log(self-report), and Other Factors among 450 Observational Study Women Energy Prentice RL, Mossavar-Rahmani Y, Huang Y et al (2011, AJE)
Calibration Equation Coefficients (β), Standard Errors (SE), and Percent of Biomarker Variation Explained (R2) from Regression of Log(biomarker) on Log(self-report), and Other Factors among 450 Observational Study Women Protein Prentice RL, Mossavar-Rahmani Y, Huang Y et al (2011, AJE)
Lessons from Studies of Dietary Consumption Effects on Chronic Disease • Control of dietary assessment measurement errors key to reliable nutritional associations with chronic disease. • Simple calibration equations that incorporate any of the of the dietary assessments considered may be adequate for epidemiologic purposes, for energy, protein and protein density. Biomarker data across a time period relevant to disease risk are needed. • Development of objective measures for other nutrients/aspects of physical activity, and methodologic research as to how to use existing nutritional measures, should have a high priority in nutritional epidemiology research agenda.
Measurement Models for Nutritional Epidemiology(Carroll, Freedman, Kaaks, Kipnis, Spiegelman, Rosner, Prentice…) Recovery Biomarkers: Wbiomarker = Z + e Qself-report = a0 + a1Z + a2V + (r + ε) Can estimate odds ratios (Sugar et al, 2007, Biometrics), or hazard ratios (Shaw and Prentice, 2011, to appear Biometrics), corresponding to Z from cohort data on W and subcohort data on X.
Hazard Ratio Estimation • Under a joint normality assumption for (Z, r + e) given V, conditional expectation of Z of the form • E (Z│Q,V) = b0 + b1Q + b2V • and • E(Z I Q,V) = E (W │Q,V) • Calibrated estimates of Z from linear regression of W on (Q,V) in the biomarker subsample • Regression calibration estimation of hazard ratios by inserting calibrated consumption estimates in Cox regression, and using a bootstrap procedure for standard error estimation
Hazard Ratio Estimates for a 20% Increment in Nutrient Consumption in Women’s Health Initiative(Prentice et al, AJE, 2009; Prentice et al, Epidemiol, 2011)
Hazard Ratio Estimates for a 20% Increment in Calibrated FFQ Energy, Protein, and Protein Density in Relation to Various Cardiovascular Disease Outcomes, from 80,330 Women Enrolled in the WHI Dietary Modification Trial Comparison Group or Observational Study