Download
1 / 3
30 likes | 285 Views
Analysing Climate Graphs. OCEANIC CLIMATE. Bergen (Norway). a. What is the hottest month? b. What is the wettest month? c. What is the total precipitation for the year? d. What is the average monthly precipitation? e. What is the average monthly temperature?

E N D
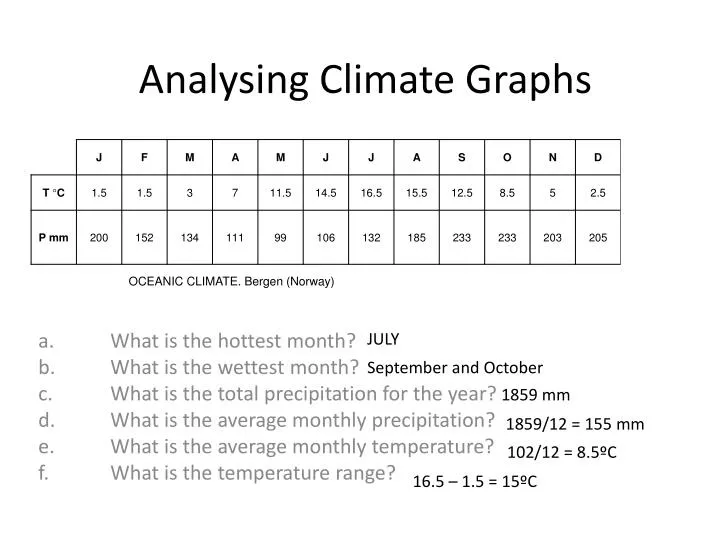
AnalysingClimateGraphs OCEANIC CLIMATE. Bergen (Norway) a. What is the hottest month? b. What is the wettest month? c. What is the total precipitation for the year? d. What is the average monthly precipitation? e. What is the average monthly temperature? f. What is the temperature range? JULY September and October 1859 mm 1859/12 = 155 mm 102/12 = 8.5ºC 16.5 – 1.5 = 15ºC
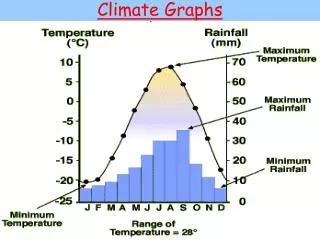
DrawingClimateGraphs • ImportantPoints: • USE A RULER!!!! • Allgraphsneed a title • Temperatureisrepresentedwith a line (normally red) • Rainfallisrepresentedwithcolumns (normallyblue) • All axis need a name and theunitsthat are used i.e. rainfall (mm), temperature (ºC) • The axis forrainfallisontheleft and the axis fortemperatureisontheright