Download
1 / 31
310 likes | 504 Views
ARO MURI on Opportunistic Sensing. MURI Topic 31 Opportunistic Sensing for Object and Activity Recognition from Multi-Modal, Multi-Platform Data. Principal Investigators Richard Baraniuk Tamer Basar John Benedetto Lawrence Carin Volkan Cevher.

E N D
ARO MURI on Opportunistic Sensing MURI Topic 31Opportunistic Sensing for Object and Activity Recognition from Multi-Modal, Multi-Platform Data Principal InvestigatorsRichard BaraniukTamer BasarJohn BenedettoLawrence CarinVolkan Cevher Principal InvestigatorsRama ChellappaRonald CoifmanLarry DavisMark Hasegawa-JohnsonThomas Huang PrincipalLydia KavrakiStanley OsherWotao Yin Program Manager Dr. Liyi DaiArmy Research Office
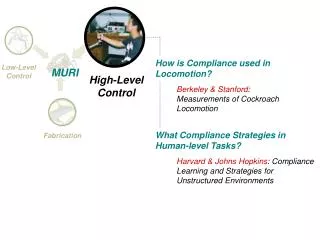
Networked Sensing • Goals • sense • communicate • fuse • infer (detect, recognize, etc.) • predict • situational awareness
Networked Sensing • Challenges • growing volume of sensor data • increasingly diverse data • diverse and changingoperating conditions • increasing mobility
Objective: Opportunistic Sensing • Objective:sensing system that automatically discovers and selects sensor modalities and sensing platforms based on an operational scenario, determines the appropriate set of features and optimal means for data collection based on these features, obtains missing information by querying resources available, and uses appropriate methods to fuse the data • Key ideas: • navigate sensing assets to conserve resources and optimize system performance • massive dimensionality reduction via compressive sensing
Research Team • Sparse signal representation and compressive sensing • Richard Baraniuk, John Benedetto, Lawrence Carin, Ronald Coifman • Pattern recognition and data fusion • Rama Chellappa, Larry Davis, Mark Hasegawa-Johnson, Thomas Huang • Optimization and navigation • Tamer Basar, Volkan Cevher, Lydia Kavraki, Stanley Osher, Wotao Yin • Leading scientists from ARL and other DOD labs
Opportunistic Sensing Case Study ARO MURI | Opportunistic Sensing | Rice, Maryland, Illinois, Yale, Duke, UCLA | October 2009
Target Models (T1) • Signal “space” of images of an articulating target due to • sensing platform navigation • moving target • N-pixel images are pointsin
Manifold Models (T1) • Signal “space” of images of an articulating target = low-dimensional manifold • Manifold dimensionL= # imaging parameters articulation parameter space
Classification (T2) data data • Signal “space” of images of an articulating target = low-dimensional manifold • Manifold dimensionL= # imaging parameters • Classification:matched filter =“closest manifold search” articulation parameter space
Navigation (T3) • Navigation in physical/configuration spacecorresponds to navigation on imagemanifolds articulation parameter space
Models + Processing + Navigation image processingsituational awareness • Navigation in physical/configuration spacecorresponds to navigation on imagemanifolds • Natural framework for opportunism & optimization navigation articulation parameter space
Conventional Sensing Sensing via uniform sampling Must sample above the Nyquist rate in order to not lose information For high-res, wide-band signals, Nyquist rate prohibitively high >> data deluge signaldegreesoffreedom measurements
Compressive Sensing (CS) Sensing via randomized dimensionality reduction Combines sensing and compression Tames data deluge Enables radically new sensors and systems sparsesignal random measurements nonzero entries
Breakthrough: CS for Manifolds Theorem: random measurements stably embed anL-dim manifoldwhp preservesdistances betweenpoints on the manifold Extension of compressivesensing to manifolds
Breakthrough: CS for Manifolds Theorem: random measurements stably embed manifoldwhp Enables image and video recovery from many fewer measurementsthan conventional CS L very small in many applications (# articulations) L << K (sparsity of images)
CS + Models + Processing + Navigation • Can conduct OS directly on compressive measurements! • Massive savings in amount of data to process/communicate
Simulation Example • Task: find and identify 2 truck targets usingcameras on 2 collaborating ground robots • Approach: navigate along the manifoldsgenerated by target training data; honorkinematic motion constraints • Occlusions • complicate classification • Obstacles • complicate navigation • Results: OS locates andclassifies trucks an order of magnitude faster than state-of-the-art
Simulation Example • Task: find and identify 2 truck targets usingcameras on 2 collaborating ground robots • Approach: navigate along the manifoldsgenerated by target training data; honorkinematic motion constraints • Occlusions • complicate classification • Obstacles • complicate navigation • Next step: Field experimentswith Packbots and differentsensor modalities (w/ ARL)
Key Research Results To Date • Dimensionality reduction • high-dimensional geometry of sparse signals, manifolds • compressive sensing theory and practice • CS based data processing • predictable inference from compressive measurements • Sensor driven navigation • manifold viewpoint links sensing, processing, navigation • Optimization • submodular optimization enables distributed operation • Broader impacts: Medical imaging, document analysis (human intelligence), …
Administrata • Total budget: $1.25M/year • Across the six campuses, project supports 11 graduate students and 5 postdocs per year • 5 student interns to ARL summers of Y1 and Y2 • Regular meetings and teleconferences • Y1 Kickoff at Rice Fall 2009 • Y2 Review ay Maryland Fall 2010 • OS Workshop at ARL Spring 2011 • Y3 Review planned for UIUC Fall 2011 • Project website: dsp.rice.edu/muripublications, presentations, …
Opportunistic Sensor Fusion Goal: Automatically discover and select sensor modalities and sensing platforms based on an operational scenario. Outdoor Personnel Detection Sensors Available: ultrasonic, seismic, acoustic Modality Selection Strategy: seismic anomaly -> acoustic power on Indoor Human Activity Detection Sensors Available: audio, visual Modality Selection Strategy: audio energy -> camera on Results, Personnel Detection Accuracy Seismic-only: 79.0% Seismic-cued Multimodal Fusion: 85.3% Results, 12-Class Event Detection & Labeling Audio-only: 77.5% Video-only: 61.6% Audio-cued Multimodal Fusion: 89.1%
Bayesian Integration of Unconventional Heterogeneous Information Sources: Basic Research Questions • There are multiple classes of information sources that may be collected across a • large battlefield (e.g., via “soldiers as sensors”), that must be integrated for commander • situational awareness • These data, collected as opportunities permit, often have different “alphabets”; some may • be imagery, others audio, others documents • Question: How do we integrate or “fuse” these different modalities, that vary with space • and time, and have distinct alphabets? • Multi-modality factor analysis may be employed, with modality-dependent factor loadings • and (low-dimensional) modality-independent factor scores • The factor scores constitute a cross-modality and time-dependent “embedding” • Questions: How many factors? Which factors should be shared across modalities and • which modalities, and which should be modality-specific and not shared?
Nonparametric Bayesian modeling of heterogeneous space-time information sources • Joint Gaussian process factor analysis of heterogeneous spatio-temporal data ( for e.g., multi-modal sensor data, econometric time-series data etc.) Here represent R different data modalities • Presence of underlying (low-dimensional) dynamic features that may be shared across all modalities, via • Each modality may also have idiosyncratic low dimensional features characterized by • Each modality has a unique mapping from these low-dimensional features to the high dimensional data, reflected by • Automatically infers the number of unique and shared factors as well as the noise/residual variance • The proposed approach can handle spatial inhomogeneity and is computationally efficient for large data
Experimental results : Joint analysis of Michigan/US unemployment rates and S & P 500 Spatial interpolation results for a single representative county in Michigan (10% counties of Michigan are used to learn the model and the remaining 90% counties are interpolated) • Proposed approach can share statistical strength • across multiple heterogeneous information sources to • improve model learning under sparse conditions • The model uncovers the dominant feature shared across all the datasets as the underlying market state 3-D latent space shared across all data modalities (black balls represent recession periods)
Data Deluge: DARPA ARGUS-IS • 1.8 Gpixel image sensor • video rate output: 770 Gbits/s • data rate input: 274 Mbits/sfactor of 2800x way out of reach ofexisting compressiontechnology • Reconnaissancewithout conscience • too much data to transmit to a ground station • too much data to make effective real-time decisions
TO DOs • 12 minutes • PIs should not give their standard overview of their MURI. Instead they need to focus on thoroughly answering questions 1, 3, 4, 5, and 6 listed in the attached memo • 1 Scientific objective and technical approach • 3 Project scientific issues: Underlying scientific principles, prior state of the art advances that favored a multi-disc approach, scientific barriers, potential scientific advances • 4 Scientific accomplishments to date and what we have learned • 5 Do you see any potential breakthroughs in this research • 6 Why is this an important research area • De-emphasized: • 2 Listing of MURI participants and number of postdocs and students • 7 Overall budget $ year by year • 8 Dates and locations of reviews and meetings • Add picture of Big Dog, mark pictures, rama pictures • Get footer (with Aug 2011) on each slide • Unify all fonts • COLLABOB WITH ARL, other DOD labs • Make sure points 1-8 are dealt with