Download
1 / 32
320 likes | 476 Views
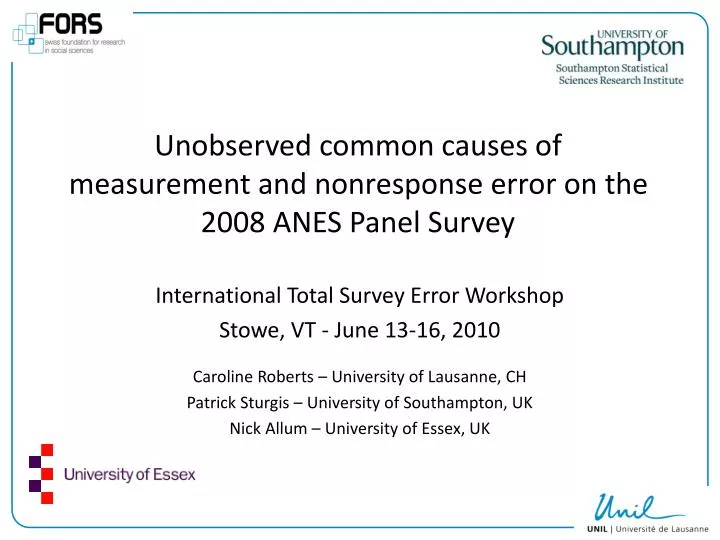
Unobserved common causes of measurement and nonresponse error on the 2008 ANES Panel Survey. International Total Survey Error Workshop Stowe, VT - June 13-16, 2010 Caroline Roberts – University of Lausanne, CH Patrick Sturgis – University of Southampton, UK

E N D
Unobserved common causes of measurement and nonresponse error on the 2008 ANES Panel Survey International Total Survey Error Workshop Stowe, VT - June 13-16, 2010Caroline Roberts – University of Lausanne, CH Patrick Sturgis – University of Southampton, UK Nick Allum – University of Essex, UK 1
Overview • Background and motivation • Objectives of this study • Data and sample • Methods • Level of effort & response propensity analysis • Structural Equation Modeling • Provisional conclusions and discussion points
Background • Several theoretical models specify ways measurement error and nonresponse bias might relate (see Olson 2007) • ‘Common cause’ model: variables influencing response propensity also influence response accuracy • Possibility to test the model restricted by data availability • Focus on individual items does not address error from suboptimal response strategies
Motivation • To what extent do common causes influence both types of error? • The role of motivation and ability • Our approach uses: • Panel data – to investigate a range of candidate common causes • Structural Equation Models to quantify the unobserved component • Theoretical and practical interest
Objectives Two elements: • Comparison of data quality based on respondent ‘cooperativeness’ in the panel: do the least cooperative differ from the most? • Analysis of common causes of response propensity and measurement error using SEM: what is the extent and magnitude of the unobserved component?
Data • 2008-2009 ANES Internet Panel Survey • Recruited by RDD telephone survey • Non-internet households got MSN Web-TV • 21 monthly Internet surveys: $10 each • Fieldwork by Knowledge Networks • Advance release data file (June 2009) include • recruitment data (including CATI paradata) • core profile survey • plus 6 ANES waves (Jan, Feb, Jun, Sep, Oct, & Nov 2008) DeBell, Krosnick, Lupia & Roberts, 2009
Sample and Fieldwork • Probability sample of US citizens aged 18+ • Data from 1 of 2 recruitment cohorts • 12,809 landline numbers; 2,371 completed recruitment (18.5%) • 4 month fieldwork – up to 50 call attempts • 2 protocol changes – • Refusal conversion by NORC • Internet-only recruitment for 50+ calls • AAPOR1 = 26% AAPOR3 = 42% • 1,738 completed recruitment + at least 1 ANES wave
Cooperativeness • 3 indicators of recruitment effort: • Number of calls to a complete interview (1-5 vs. 6 or more) • Whether respondent or household member refused to participate during call attempts (refused once or more vs. never refused) • Respondent recruited after protocol change (by internet or refusal conversion vs. by standard telephone) • Actual response propensity • Differences in sample composition, responsiveness, key survey estimates, data quality
Data quality • Indicators of survey satisficing (Krosnick, 1991) • Item non-response (wave 1 only) • Non-differentiation of items with same response scale • Preference for midpoints in branched questions • Item sets repeated across several ANES waves: • Condition of the country (5 pts); candidate liking, attitudes to groups, policy attitudes, candidate policy positions (branched 7-pt scales) • Validity checks • Consistency and accuracy of reports – e.g. voting (but see Berent et al. 2010)
Results • Few significant differences in refusal and protocol change comparisons • But respondents recruited after 6+ calls are: • Younger and more likely to be Black, non-Hispanic • less likely to have Internet access • Less likely to be Republican and conservative • Slightly more likely to satisfice • And reluctance at recruitment leads to lower cooperation in panel
Summary • Level of effort analysis: • Small differences between respondents as a function of ‘effort’ required to recruit them • Significant differences in their cooperativeness at later panel waves • Significant differences in demographics, on key survey estimates, and on satisficing between more and less cooperative panel recruits • A few differences on substantive items used in satisficing indicators, but not many
Common causes • Ability: • Education • Computer/Internet literacy • R required MSN-TV device • Motivation: • Recruitment difficulty • Interest in computers • Interest in politics • Demographic characteristics • sex, age, race & ethnicity
Recruitment difficulty • N of refusals • N of calls to complete Response Ability • N of panels started • Education Common cause? Motivation Correlated residual • Interest in politics • Interest in computers Satisficing • Non-differentiation • Use of midpoints Demographics • Sex • Age • Race • Web access
SEM Estimates RMSEA<.05; CFI>.95
Summary 2 • SEM: • Very weak correlation between satisficing and propensity to respond – a ‘reassuring’ result? • Recruitment difficulty predicts response propensity but not satisficing • Motivation variables better predict satisficing; ability better predicts response. Both together can jointly account for the weak correlation between propensity to respond and satisficing.
Discussion points • Limitations: • absence of external records • advance release data • specification of SEM • Can we improve measures of responsiveness and satisficing (including choice of item sets)? • How can we best utilize the strengths and compensate for the limitations of the panel design
Thank you caroline.roberts@unil.ch
Recruitment variables ★ Very or extremely ★★About many things or just about everything