Download
1 / 13
130 likes | 148 Views
Learn how to graph rational functions, identify asymptotes, and understand continuity in advanced math topics. Practice finding horizontal and vertical asymptotes, point discontinuities, and solving word problems.

E N D
Lesson 2-7: Graphing Rational Functions Advanced Math Topics
Definitions • Continuity: a graph that is able to be traced without picking up the pencil • Asymptote: a line that the graph of the function approaches, but never touches (graphed as a dotted line) • Point discontinuity: a hole in the graph
Vertical Asymptote To find a vertical asymptote: set the denominator factor(s) equal to zero and solve
Horizontal Asymptote To Find A Horizontal asymptote :look at the degrees of the numerator and denominator *If the degree of the denominator is greater than the degree of the numerator, then the horizontal asymptote is y=0 *If the degree of the denominator is equal to the degree of the numerator then the horizontal asymptote is found by dividing the coefficients of the leading terms. y=1, is the horizontal asymptote because the coefficients of the leading terms = =1
Point Discontinuity Point discontinuity happens when you factor the numerator and denominator and the denominator factor is canceled. The value of x that makes the denominator zero is the point of discontinuity.
Evaluate Rational Functions just like you would any other function. Finding f(4) simply means plug 4 in for x. • When you are looking for x and you know f(x) = some # then you replace the f(x) in function notation with the # you are given and solve for x
Word Problems • Roy took two tests and his average is 63. If he scores 100 on the rest of his tests, how many more tests does Roy need to take to raise his average to 85?
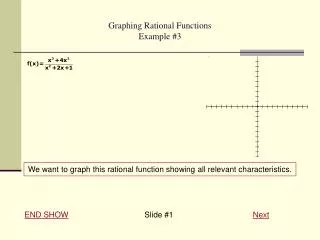
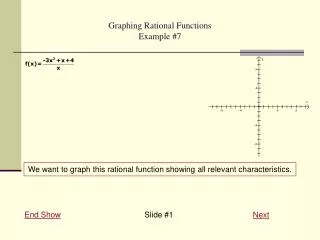
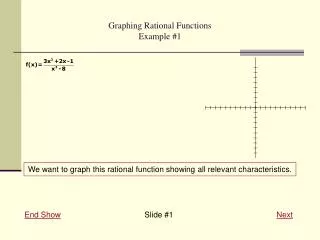
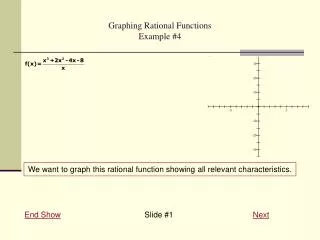
Steps to Graph a Rational Function • 1. Factor and simplify if you can • 2. Look for the vertical asymptote and horizontal asymptote • 3. Draw asymptotes as dotted lines on your graph • 5. Find 3 x values greater than the vertical asymptote and 3 less than the vertical asymptote • ( If there is no vertical asymptote you must make a t-chart and find at least 5 points to sketch the graph) • 6. graph the points and stretch the curve toward the asymptotes.