Download
1 / 96
960 likes | 971 Views
This guide covers process modeling quality, requirements, validation, simulation, approaches, participants, tools, simulation benefits, process analysis purpose, when to perform analysis, roles, process design principles, and design considerations.

E N D
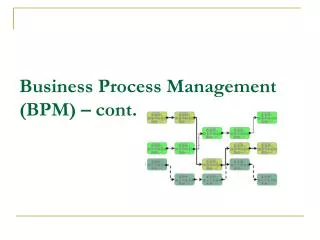
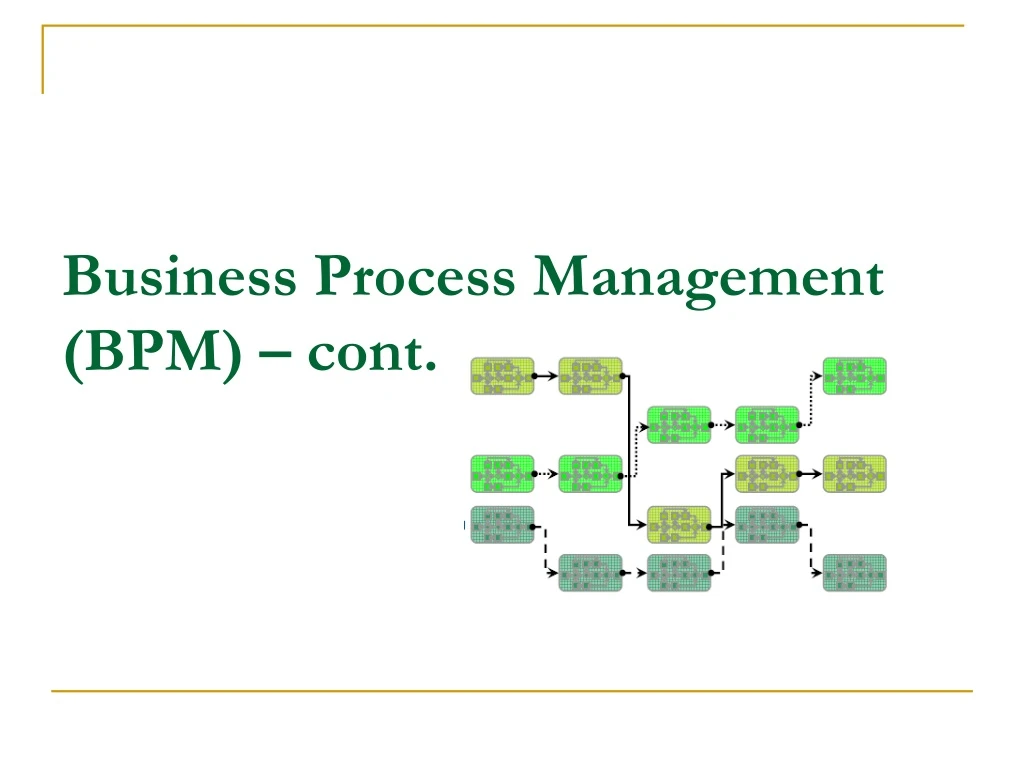
Process Modelling Quality • Most process analysis and design efforts require the use of models to describe what is happening during the process • Useful to have some standards and measures of quality as it relates to process modeling • Quality of model defined by its accuracy, amount of detail and completeness
Requirements of a Process Model • Business environment • Organisational structure • Business rules • Process structure
Model Validation and Simulation • Useful or necessary to validate the model throughsimulation • Validate the model through simulation is to compare simulated outputs to real-world results
Modelling Perspectives • Processes can be modelled from manyperspectives • All perspectives are maintained in a process repository
Modelling Approaches • Bottom-up • Top-down • Middle-out
Capturing Information for Process Modelling • Direct Observation • Interviews • Survey/Written Feedback • Structured Workshops • Web-Based Conferencing
Modelling Participants • Business strategists • Business managers • Financial analysts • Auditors • Compliance analysts • Process performance analysts • Requirements analysts • Systems analysts • Business analysts
Modelling Techniques and Tools • White Boarding and Flip Charts • Paper and Post-Its • Drawing Tools and Reports (e.g. Visio, PowerPoint) • Electronic Modelling and Projection: • Repository-based tools allow the reuse of objects orpatterns that have already been defined in previous efforts
Process Simulation • Form of models which provide valuable insight to process dynamics • Simulations require sufficient data which typically allows the processto be mathematically simulated under various scenarios, loads, etc. • Simulations can be manual or electronic using process simulationtools • Various benefits
Purpose of Process Analysis • Process analysis is an essential tool to show how well thebusiness is meeting its objectives • Due to business change the processes of an organisationcan quickly become inconsistent to their original designand no longer meet the needs of the business • Analysis generates an understanding and measurement of processeffectiveness and its efficiency • Information generated from analysis includes: • Strategy, culture and environment of the organisation that uses the process (why the processexists) • Inputs and outputs of the process • Stakeholders, both internal and external, including suppliers, customers and their needs andexpectations • Inefficiencies within the current process • Scalability of the process to meet customer demands • Business rules that control the process and why they must exist • What performance metrics should monitor the process, who is interested in those metrics andwhat they mean • What activities make up the process and their dependencies across departments and businessfunctions • Improved resource utilisation • Opportunities to reduce constraints and increase capacity
When to Perform Process Analysis • Can be the result of continuous monitoring of processes orcan be triggered by specific events, such as: • Strategic Planning • Performance Issues • New Technologies • Startup Venture • Merger/Acquisition • Regulatory Requirements
Process Analysis Roles • Performed by a single individual or by across-functional team • Analyst • Decide the depth and scope of the analysis • How it is analysed • Perform the analysis • Provide documentation and final reports to the stakeholders and executive leadership • Facilitator • Lead process analysis teams with an unbiased view • Subject Matter Experts • Individuals closest to the process with knowledge and expertise • Familiar with both the business and technical infrastructure that supports theprocess
Preparing the Analysis • Choose the process • Determine the scope of the depth of analysis • Choose analytical frameworks
Process Design Principles (1) Design around customer interactions Design around value-adding activities Minimise/ automate handoffs Work is performed where it makes the most sense Provide a single point of contact Ensure a continuous flow Reduce batch size: batching causes wait time for items at the end of the batch Capture information once at the source and share it: eliminate data redundancy Involve as few as possible Redesign, then automate Ensure quality at the beginning
Process Design Principles (2) • Standardise processes: when there is no standardisation there cannot be process control • Use co-located or networked teams for complex issues • If complex problems occur regularly, consider co-locatingteam members • If co-location does not make sense, then network the teamso information can smoothly flow • Consider outsourcing business processes • Compare to the costs of designing the process in-house aswell as compared to the risks associated with outsourcing • Process Compliance • Process Design Considerations
Key Process Performance Definitions • All processes have a metric ormeasurement associated with the workor output of the process that isperformed • Metrics are based on the followingfundamental metric dimensions: time, cost, capacity, quality • When a process is value-added? • When it is required to generate the output required by the customer of theprocess • When the customer is willing to pay for the process • When it enhances customer experience
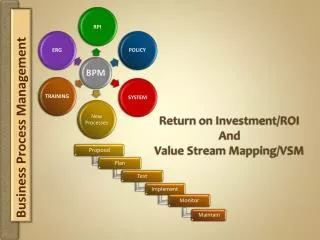
Measurement Methods • Several common measurement methodologies used inBPM implementations • Value Stream Mapping • Activity Based Costing (ABC) • Statistical Methods
BPM Improvement Methodologies An approach with principles, procedures and practices that provide guidelines for designing and executing the different components within BPM
Other Methodologies • Lean: • originated by Toyota • Focuson reduction of process wastes • TQM (Total Quality Management) • focus on process measurement and controls as a megans ofcontinuous improvement • statistical analysis • Performance Improvement Model • developed in the early1990s • framework aligns processes at three distinct three levelsof performance: organisational, process and job/ performer • Redesign • although it may lead to significant changes, these changescontinue to be based on the fundamental concepts of theexisting process • Reengineering • Mike Hammer’s 1993 book Reengineering the Corporation • radical change of process
Activity Specification • Each implementation activity specification should include: • Objectives, performance metrics and list of deliverables—all related todelivering improved customer value • Risks for completion and how to be minimised • Accountability for completion • Financial, personnel, any IT support and other resources required • Length of time for completion • Any implementation task cross-functional interdependencies
What is good quality? • Please list 3 characteristics of a good quality car.
What is a “good quality” mobile phone? • List 3 characteristics of a good quality phone. • How about the characteristics of a process to make a phone?
Definition of Quality • IEEE (IEEE_Std_610.12-1990) : • the degree to which a system, component, or process meets specified requirements/ customer or user needs or expectations • Fault (according to ISO/CD 10303-226): • “an abnormal condition or defect at the component, equipment, or sub-system level which may lead to a failure” • Failure: • the state or condition of not meeting a desirable or intended objective • Defect: • see fault
Root Cause Analysis (RCA) • RCA is used to find the root causes of defects – what is the cause of the failure • RCA can be done using a number of methods: • Barrier analysis • Causal factor tree analysis • Change analysis • Failure mode and effects analysis • Fault tree analysis • 5 Whys • Ishikawa diagram • Pareto analysis
5 Whys: Example • Problem Statement: You are on your way home from work and your car stops in the middle of the road. 1. Why did your car stop? - Because it ran out of gas. 2. Why did it run out of gas? - Because I didn't buy any gas on my way to work. 3. Why didn't you buy any gas this morning? - Because I didn't have any money. 4. Why didn't you have any money? - Because I lost it all last night in a poker game. 5. Why did you lose your money in last night's poker game? - Because I'm not very good at "bluffing" when I don't have a good hand.
Ishikawa Diagram: Principles • Causes are grouped into categories and linked together (primary and secondary causes) • The list of categories is not definite, the figure shows the “typical” • Relationships are used to backtrack the cause of a particular problem. • The analysis requires more effort than 5 whys but still no statistics is necessary.