Download
1 / 19
• 190 likes • 213 Views
Learn how to choose the ideal spatial reference for Gulf of Mexico data in this adapted guide. Explore projection methods and tools for accurate modeling and analysis of deepwater oil exploration impacts.

E N D
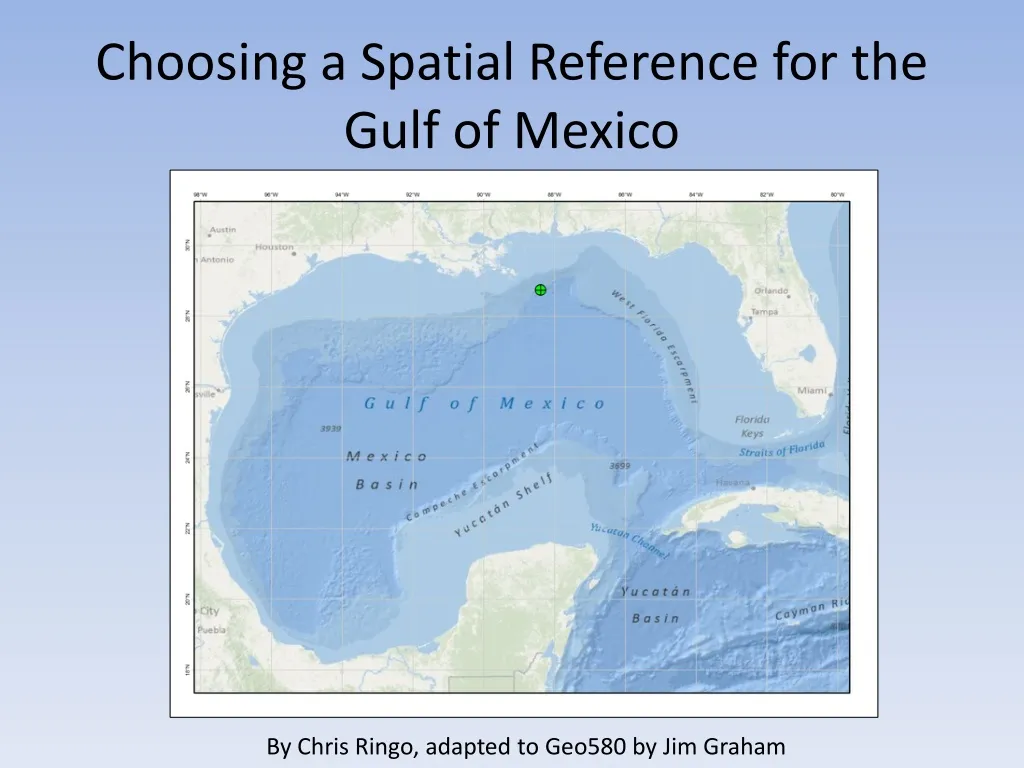
Choosing a Spatial Reference for the Gulf of Mexico By Chris Ringo, adapted to Geo580 by Jim Graham
“Deepwater” project will model potential impacts of deep water oil exploration and development in the Gulf of Mexico • Gather relevant spatial datasets • Model species abundance for various commercial & non-commercial species • Model physical processes such as oil plumes and subsequent transport • Model potential impacts of various hydrocarbons on species, including economic impacts to fisheries
First step in a project:decide on a common spatial reference for your data! Regional data Global data Local data
OK, so a lot of the data I’m seeing is in geographic coordinates AVHRR Sea Surface Temperature (“4km” – actually, .0439 deg) MODIS AQUA chlorophyll-a content (2.5 minutes) ETOPO Global Relief (1 minute)
Why not just use geographic?Because 1o latitude ≠ 1o longitude …
Why not just use geographic?… and “cells” do not represent equal areas
So, we need to put our data in a projected coordinate system because: • We want to be able to make reasonably accurate estimates of distances • We want to be able to make reasonably accurate estimates of areas You won’t be able to do this easily with geographic coordinates
Which projection to use where? One "traditional" rule described in Maling, 1992 (dating from the 16th century) says: • A country in the tropics asks for a cylindrical projection. • A country in the temperate zone asks for a conical projection. • A polar area asks for an azimuthal projection.
The US part of the Gulf of Mexico is north of the tropics: try a conic
Try an Albers Equal-Area Projectionwith two standard parallels
One method for measuring distortion: pick a few points and measure distances • Add points with lat-long coordinates • Set the data frame to the projected coordinate system to be tested • Measure distances on the map • Calculate ellipsoidal distance between points: www.ngs.noaa.gov/cgi-bin/Inv_Fwd/inverse.prl
Another method: download the Distortion Analysis Tool for ArcMap This tool produces an analysis of map projection distortion for a given area of interest and target projection. Areal, angular and scale distortion are analyzed using an approximation of Tissot’sindicatrix and areal distortion is also analyzed using a grid from an equal area projection
References • Maling (1992): Coordinate Systems and Map Projections (out of print) • Snyder (1987): Map Projections – A Working Manual (PDF available at pubs.usgs.gov) • Snyder (1989): An Album of Map Projections (PDF available at pubs.usgs.gov)
References Application to measure distance between lat-longs • http://www.ngs.noaa.gov/cgi-bin/Inv_Fwd/inverse.prl Distortion Analysis Tool for ArcMap 9.3 • Google “Projection Distortion Analysis” And of course, the Justin Bieber fan site • http://www.justinbieberzone.com