Download
1 / 20
200 likes | 233 Views
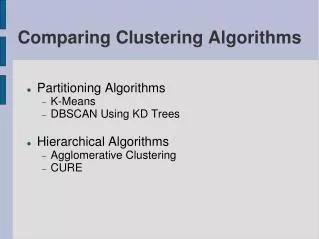
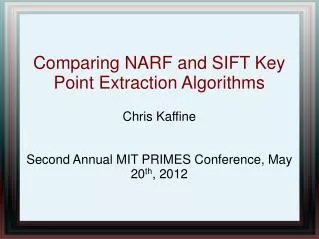
This study compared NARF and SIFT algorithms in extracting key points from range sensors, assessing key point identification, persistence, and density. The methods, metrics, and results of evaluating the algorithms are discussed.

E N D
Chris Kaffine Second Annual MIT PRIMES Conference, May 20th, 2012 Comparing NARF and SIFT Key Point Extraction Algorithms
Range Sensors • Purpose: collect distance information • Advantage over cameras: 3D • Methods: • Stereo Imagery • LiDAR • Structured Light
Representing Range Data • Point Clouds: • 3D-coordinates • Geometrically understandable • Range Images: • 2D-image with pixel values representing depth • Similar to sensor functioning • Allows border extraction
Correspondences • Goal: Find points in two images which are equivalent • With matched points, differences between images can be calculated
Key Points and Descriptors • Find correspondences in two steps: find key points, calculate descriptors • Key Points- Distinguishable, stable locations in a scene • Descriptors- Numerical description of a point and its underlying surface • Points with similar descriptors are correspondences
NARF • Normally Aligned Radial Features • Uses range images • Uses borders and change in distance (pixel) values to identify key points • Key points are invariant to scale, susceptible to camera orientation • Support Size: indicates how detailed the search should be
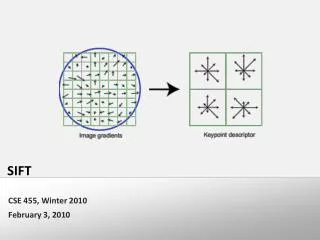
SIFT • Scale Invariant Feature Transform • Uses point clouds • Finds key points that are invariant to scale • Utilizes full, 3D geometry • Scale Size: indicates how close to “zoom in”
Evaluating the Algorithms • Use data with known sensor location • Within chronologically adjacent frames, search for nearby key points • Points within a certain distance are considered true matches • Count number of frames each point lasts for • Repeat, using different algorithms with different parameter values and different distance thresholds
Evaluating the Algorithms • Metrics for evaluation: • Number of key points identified • Persistence/Stability of key points • Density of key points, with relation to distance threshold • Due to limitations in persistence algorithm, two persistence metrics were used: • Measure 1:Average persistence of all key points • Measure 2: Number of key points with persistence greater than 1
Results- Measures of Success • Measure 1: Smoother, NARF exceeds SIFT in parts • Overall, similar trends, though distinct metrics
Results- Measures of Success • Measure 1: Smoother, NARF exceeds SIFT in parts • Overall, similar trends so overestimation most likely did not have a strong effect
Results- Measures of Success • At low parameter values, SIFT key point numbers and density rise dramatically, NARF values rise steadily • Indicates that as parameter values decrease, superfluous key points are detected
Results • Best parameter values for each algorithm displayed • Metric used: #key points * persistence / density • SIFT almost always superior • Scale size .07 better in general, 0.1 possibly better in some cases
Acknowledgements • MIT PRIMES • Professor Seth Teller • Jon Brookshire – Mentor