Download
1 / 13
130 likes | 151 Views
Learn to identify functions, find domain and range of relations, and express relationships as tables, graphs, and mapping diagrams. Explore examples like track meet scoring system to enhance understanding.

E N D
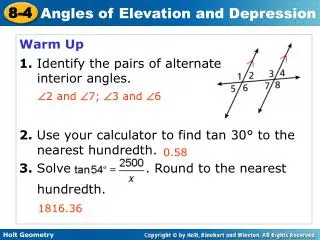
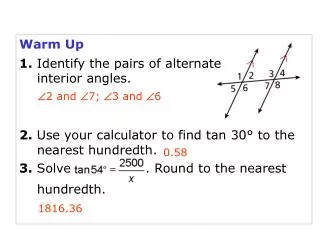
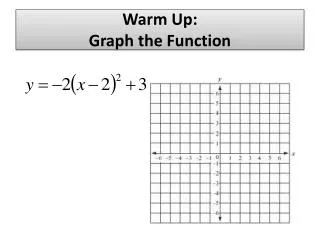
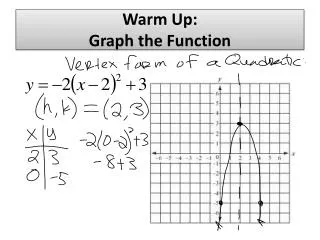
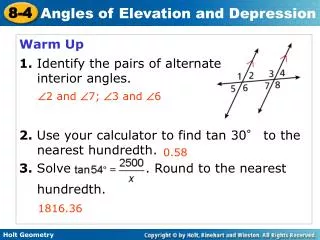
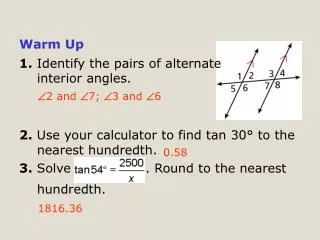
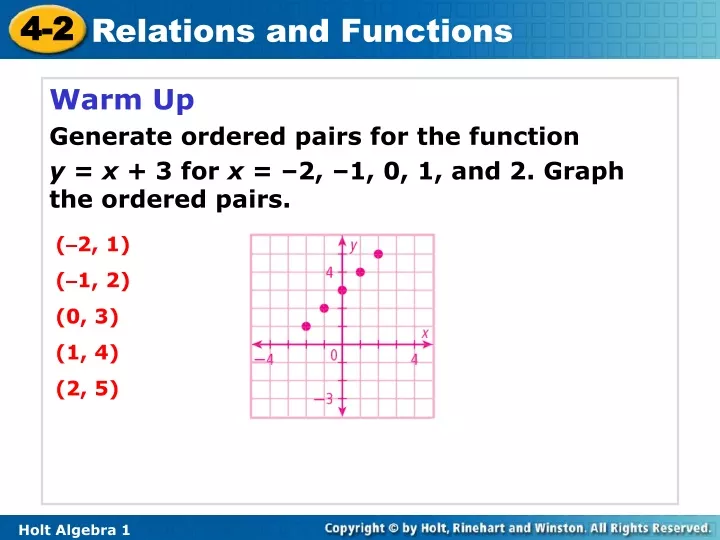
Warm Up Generate ordered pairs for the function y = x + 3 for x = –2, –1, 0, 1, and 2. Graph the ordered pairs. (–2, 1) (–1, 2) (0, 3) (1, 4) (2, 5)
Objectives Identify functions. Find the domain and range of relations and functions.
Vocabulary relation domain range function
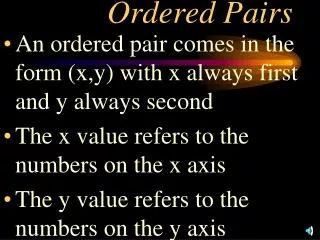
In Lesson 4-1 you saw relationships represented by graphs. Relationships can also be represented by a set of ordered pairs called arelation. In the scoring systems of some track meets, for first place you get 5 points, for second place you get 3 points, for third place you get 2 points, and for fourth place you get 1 point. This scoring system is a relation, so it can be shown by ordered pairs. {(1, 5), (2, 3), (3, 2) (4, 1)}. You can also show relations in other ways, such as tables, graphs, or mapping diagrams.
Directions: Express each relation as a table, as a graph, and as a mapping diagram.
Table x y 2 3 4 7 6 8 Example 1 Relation: {(2, 3), (4, 7), (6, 8)} Write all x-values under “x” and all y-values under “y”.
Example 1 Continued Graph Use the x- and y-values to plot the ordered pairs.
2 3 4 7 6 8 Example 1 Continued Mapping Diagram y x Write all x-values under “x” and all y-values under “y”. Draw an arrow from each x-value to its corresponding y-value.
x y Example 2 Relation: {(1, 3), (2, 4), (3, 5)} Table Write all x-values under “x” and all y-values under “y”. 1 3 2 4 3 5
Example 2 Continued Graph Use the x- and y-values to plot the ordered pairs.
Example 2 Continued Mapping Diagram y x 1 3 Write all x-values under “x” and all y-values under “y”. Draw an arrow from each x-value to its corresponding y-value. 2 4 3 5
The domain of a relation is the set of first coordinates (or x-values) of the ordered pairs. The range of a relation is the set of second coordinates (or y-values) of the ordered pairs. The domain of the track meet scoring system is {1, 2, 3, 4}. The range is {5, 3, 2, 1}.
Lesson Summary 1. Express the relation {(–2, 5), (–1, 4), (1, 3), (2, 4)} as a table, as a graph, and as a mapping diagram.