Download
1 / 72
720 likes | 836 Views
Science and Restoration 2009 Priorities. 2009 Science Activities. 1. Conferences & Workshops Delaware Estuary Science Conference Workshops Science and Technical Committees STAC Affiliated Workgroups and Subcommittees 3. Watershed-Level Initiatives

E N D
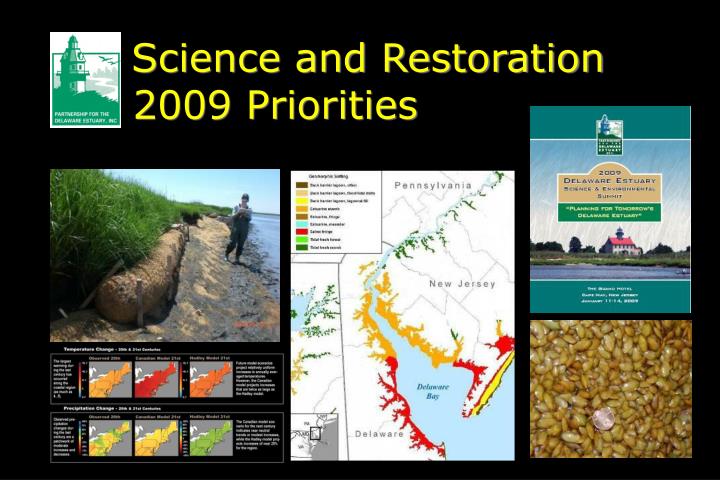
Science and Restoration 2009 Priorities
2009 Science Activities • 1. Conferences & Workshops • Delaware Estuary Science Conference • Workshops • Science and Technical Committees • STAC • Affiliated Workgroups and Subcommittees • 3. Watershed-Level Initiatives • Science Priority Setting (White Paper) • Conceptual Framework • Indicators, Goals, Monitoring • State of the Estuary • 4. Science & Restoration Projects • Delaware Estuary Benthic Inventory • Freshwater Mussel Recovery Program • Delaware Estuary Living Shorelines • Regional Restoration & Natural Capital Initiative • Climate Ready Estuaries • Wetland Monitoring and Assessment • 5. Web-Based Info & Data Management
2009 Science Activities • 1. Conferences & Workshops • Delaware Estuary Science Conference • Workshops • Science and Technical Committees • STAC • Affiliated Workgroups and Subcommittees • 3. Watershed-Level Initiatives • Science Priority Setting (White Paper) • Conceptual Framework • Indicators, Goals, Monitoring • State of the Estuary • 4. Science & Restoration Projects • Delaware Estuary Benthic Inventory • Freshwater Mussel Recovery Program • Delaware Estuary Living Shorelines • Regional Restoration & Natural Capital Initiative • Climate Ready Estuaries • Wetland Monitoring and Assessment • 5. Web-Based Info & Data Management
Climate Change in the Delaware Estuary Temp Salinity Sea Level Rise Storms Drinking Water Uplands Tidal Marshes Shellfish • Likely Physical Changes 2. Example Effects on Resources
Species Range Shifts
Non-linear Ecological Responses Smooth Response NPP ↑ 20% Resp ↑ by 43% Abrupt Response Ecosystem Response Ecosystem Response Threshold Extent of Climate Change Slide adapted from Carlos Duarte Extent of Climate Change
Non linear shifts in ecosystem status Tipping points or breaking points of the system Once breached, ”recovery” may be slow or unlikely Slide from Carlos Duarte Ecological Thresholds Pressure (Climate change) Knowing where these tipping points are will be extremely valuable to set policy targets (Climate-driven Thresholds)
Decreasing Nutrient Inputs Chlorophyll Increasing Nutrient Inputs The Reality Decreasing Nutrient Inputs Chlorophyll Chlorophyll Increasing Nutrient Inputs Example – Nutrients The Expectation Slide and principles, Duarte et al. (submitted) Ecosystem Trajectories Rarely Reverse Course “Reference Values” are Dynamic New Buffers Become Established to Reinforce New Steady States
Lesson: “Restore” for the Future • Forecast future sustainable states • Targeted restoration and climate adaptation
Example: Oysters From Rutgers HSRL
Salt Line Location Oyster Disease, Salinity & Climate Change From Rutgers HSRL From DRBC www.livingclassrooms.org/lbo/dermo/oyster2.jpg Rutgers: “A 2 parts per thousand increase in salinity over the seed beds may push the oysters past a point of no return”
No Help With Help Oyster ManagementCan they maintain (or be maintained) until they might see more optimal conditions? Longer Growing Season 2 Recruitment Events Intertidal Niche Expansion? Point of No Return Today 2030 2060 Historical data from Rutgers Haskin Shellfish Laboratory
Other Hypothetical Non-Linear Responses: Decoupling of Horseshoe Crab Spawning and Shorebird Migration Website slides are from the Delaware Shorebird Project and the Horseshoe Crab Conservation Network
Plans for Adaptation Plans High Need Escalating Interest New Programs Still.. Little On-the-Ground Action • Recent CSO Survey: • 80% of coastal states plan to develop sea level rise adaptation plans • only 3 have made any progress • no standard approach • little federal coordination
Adaptation Planning (in addition to mitigation) • Vulnerability– forecast and assess risks • Opportunity– identify activities that can help offset vulnerabilities to key natural resources • Obstacles– identify potential barriers to action(e.g., interstate cooperation, data comparability, etc.) • Adaptation Plan– recommend actions for filling information needs, capitalizing on highest value opportunities, and overcoming obstacles
PDE Climate Ready Pilot • Goal– perform a vulnerability assessment and draft adaptation plan for one or more case studies • Tasks • Vulnerability/Risk Assessment - inventory threats to natural resources • Valuation - Assess natural goods and services that are at risk • Identify Options – List management response scenarios, including early warning monitoring needs, and prioritize adaptation options to safeguard or enhance resources at risk • Recommendations - Provide managers and policy-makers guidance on how to achieve greatest natural resource outcomes
Adaptive Adaptation Case Study Subgroups Prioritization Outreach, Education, Messaging Management and Policy PDE Climate Ready Approach Climate Workgroup Adaptation Plan
ID Vulnerabilities Ecological Valuation Tidal Marshes Bivalve Shellfish Adaptation Options Recommendations and Reporting Drinking Water Climate Adaptation Planning Case Studies Kreeger 20
Climate Adaptation Work Group (CAWG) STAC-affiliated; Chair: Dan Soeder ID Vulnerabilities Tidal Wetland Sub-group Velinsky & Kreeger Ecological Valuation Shellfish Sub-group Kraeuter & Kreeger Drinking Water Sub-group Connolly Adaptation Options Predications & Modeling Team Najjar Recommendations and Reporting $ Natural Capital Team Cole Climate Adaptation Planning Work Groups 21
ID Vulnerabilities Ecological Valuation Tidal Marshes Bivalve Shellfish Adaptation Options Recommendations and Reporting Drinking Water Climate Adaptation Planning Case Studies Kreeger 22
Delaware Estuary Wetland Monitoring & Assessment Program (DEWMAP) Freshwater Tidal Marsh Salt Marsh
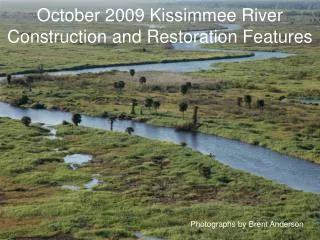
Angola Neck – Rehoboth Bay, DE Summer, 2006 Sudden Wetland Dieback – Marsh Browning Slide from Chris Bason (Center for Inland Bays, DE)
ShorelineErosion Courtesy D. Bushek, Rutgers Courtesy J. Gebert, ACOE
Vulnerability: will wetlands be converted to open water? Slide adapted from Michael Craghan, Rutgers Reed et al., unpublished draft as of Feb. 2008
Satellite Data – Kearney and Riter 1993 Percent vegetation 2006
Satellite Data – Kearney and Riter 1993 Percent vegetation near Philadelphia airport 2006
Tidal Wetlands Adaptation PlanningGoal: Maximize long-term ecosystem health and resiliency • Tough Choices • Where will wetlands will be • converted to open water? • Where can we save them ? • Where is strategic retreat • the best option?
ID Vulnerabilities • Subgroup Formed • Contractor SOW & Budget • Initiating Vulnerability Assessment • Draft for Summer CAWG Meeting Tidal Wetland Sub-group Velinsky & Kreeger Ecological Valuation Adaptation Options Late Fall Recommendations and Reporting Winter Climate Adaptation Planning Status 34
ID Vulnerabilities Ecological Valuation Tidal Marshes Bivalve Shellfish Adaptation Options Recommendations and Reporting Drinking Water Climate Adaptation Planning Case Studies Kreeger 35
Susquehanna Brandywine River, PA Elliptio complanata Delaware Estuary Marshes Geukensia demissa Delaware Bay Oysters Crassostrea virginica Brandywine River, PA
12+ Other Species of Freshwater Unionid Mussels Corbicula fluminea Rangia cuneata Mya arenaria Mytilus edulis Ensis directus Mercenaria mercenaria Other Species Elliptio complanata Geukensia demissa DRBC Crassostrea virginica
Importance of Shellfish to the Delaware Estuary Watershed Other Services Shoreline Protection Slide adapted from R. Brumbaugh’s, and Courtesy L. Coen, SCORE South Carolina
Importance of Shellfish to the Delaware Estuary Watershed Natural Capital Value
System Linkages ? 11 Other Species of Freshwater Unionid Mussels Corbicula fluminea Elliptio complanata Rangia cuneata Mya arenaria Geukensia demissa Mytilus edulis Ensis directus Mercenaria mercenaria Crassostrea virginica DRBC
ID Vulnerabilities • Subgroup Formed • Contractor SOW & Budget • Initiating Vulnerability Assessment • Model Runs for Salinity & Volume • Draft for late summer Ecological Valuation Shellfish Sub-group Kraeuter & Kreeger Adaptation Options Late Fall Recommendations and Reporting Winter Climate Adaptation Planning Status 42
ID Vulnerabilities Ecological Valuation Tidal Marshes Bivalve Shellfish Adaptation Options Recommendations and Reporting Drinking Water Climate Adaptation Planning Case Studies Kreeger 43
ID Vulnerabilities • Subgroup Formed • Intern Hired • Soon Initiate Vulnerability Assessment • Draft by late summer Ecological Valuation Drinking Water Sub-group Connolly Adaptation Options Late Fall Recommendations and Reporting Winter Climate Adaptation Planning Status 44
Climate Adaptation Work Group (CAWG) STAC-affiliated; Chair: Dan Soeder ID Vulnerabilities Tidal Wetland Sub-group Velinsky & Kreeger Ecological Valuation Shellfish Sub-group Kraeuter & Kreeger Drinking Water Sub-group Connolly Adaptation Options Predications & Modeling Team Najjar Recommendations and Reporting $ Natural Capital Team Cole Climate Adaptation Planning Work Groups 45
ID Vulnerabilities • Subgroup Formed • Contract with Penn State • Temp. & Precip. Models Underway Ecological Valuation Adaptation Options Predications & Modeling Team Najjar Recommendations and Reporting Climate Adaptation Planning Status 46
Climate model results for the watershed of the Delaware Estuary Raymond Najjar Department of Meteorology The Pennsylvania State University May 2009
Goals • Assess the performance of climate models for the watershed of the Delaware Estuary • Provide climate projections under two greenhouse gas emissions scenarios for this region R. Najjar, PSU – Draft not for distribution
Analysis domain Results presented will be averaged over this 1º× 3º domain R. Najjar, PSU – Draft not for distribution
Model evaluation: monthly means • Models tend to be slightly too cool and wet, on average. • Models differ substantially in their precipitation simulations. R. Najjar, PSU – Draft not for distribution