Download
1 / 9
90 likes | 137 Views
This lab aims to determine sugar concentration using a hydrometer. Learn to create a calibration curve graph and analyze solutions to calculate sugar levels accurately. Understand the importance of precise measurements and avoiding errors in the experiment.

E N D
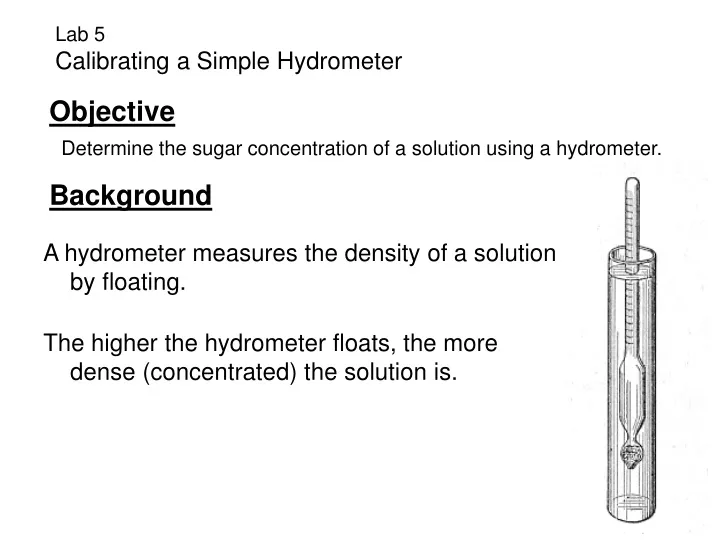
Lab 5 Calibrating a Simple Hydrometer Objective Determine the sugar concentration of a solution using a hydrometer. Background A hydrometer measures the density of a solution by floating. The higher the hydrometer floats, the more dense (concentrated) the solution is.
Pour about 50.0 mL of pure water into a 50 mL grad. cyl. Measure the height of the stem above the liquid level. Prepare your solutions using tap water and the correct grams of sugar.
Analysis 1. Create a graph that displays the height of the hydrometer stem vs. sugar concentration. Place the sugar concentration on the horizontal axis and the stem height (in cm) on the vertical. Connect the dots on this graph with a ‘best fit‘ line. This is your calibration curve. Don’t forget to label the axis’s, units, and give a title to the graph. 2. Use your calibration curve to determine the approximate sugar concentration in the unknown. Results
Questions 1. Why is it important that no water was added to the hydrometer during this lab? 2. Name three sources of error in this experiment. 3. What is a hydrometer? 4. People claim that it is easier to float in the ocean that in a lake or pool, explain why. 5. Was it important to always use 50 mL of solution? Explain why or why not.