Download
1 / 21
210 likes | 324 Views
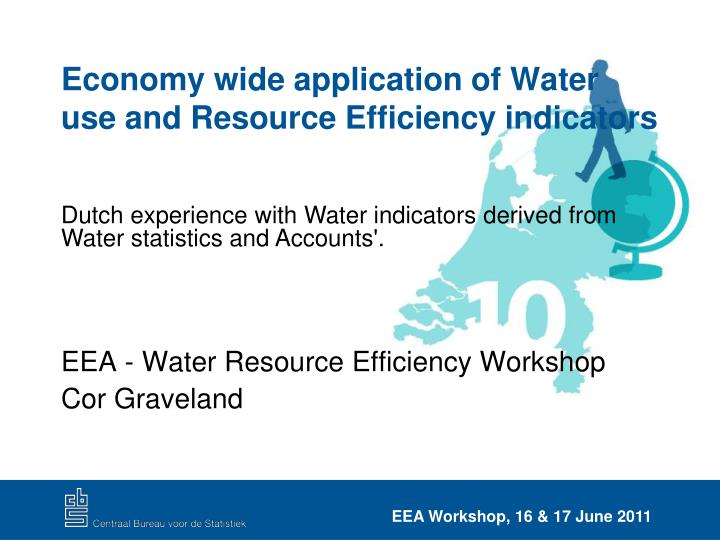
Economy wide application of Water use and Resource Efficiency indicators. Dutch experience with Water indicators derived from Water statistics and Accounts'. EEA - Water Resource Efficiency Workshop Cor Graveland. Outline. Introduction Dutch Water Accounts Physical and Economic Account

E N D
Economy wide application of Water use and Resource Efficiency indicators Dutch experience with Water indicators derived from Water statistics and Accounts'. EEA - Water Resource Efficiency Workshop Cor Graveland
Outline • Introduction • Dutch Water Accounts • Physical and Economic Account • Work in progress on Water accounts in NL • Water resource Indicators • Questions / Discussion Dutch application of Water use and Resource Efficiency indicators
Dutch water accounts • Part of environmental accounts • Definitions of and input from national accounts • Definitions follow SEEA-water (and IRWS) • Build upon water statistics • Compiled for National Water Service • Used for EU-WFD reporting • Since 2002, time series from 1995-2008 (1990-2009) • With Water statistics: • EEA SOER, data per RB • ES, Regional Environment Questionnaire (RB) Dutch application of Water use and Resource Efficiency indicators
Structure water accounts • Physical water account (m3) • Emission account (kg) • Economic account (€) • 1,2,3 integrated in NAMWA (National Accounting Matrix including Water Accounts) Dutch application of Water use and Resource Efficiency indicators
Physical water account • Supply and use of water (products) in the Dutch economy in m3 • Use: tap water, groundwater, surface water (other water) • Abstraction: surface water, groundwater • Resident principle • Distributed over 58 industries and households • Data sources: environmental reports (PRT-Register), data from water companies and detailed information from LEI • Connect to monetary water data in NA • Time series 2003-2008 (historic figures 1990-2001) Dutch application of Water use and Resource Efficiency indicators
Physical water account ((Dutch water accounts (2) )) Scale: • National and • (sub-)River basins (pilot project 2009-2010) Dutch application of Water use and Resource Efficiency indicators
Physical water account, compilationMethod from 2003 onwards, sources: • National Accounts • - Use and supply • Inform water prices • Labour Accounts AERs, An. Env. Reports ‘Water statistics’ Groundwater- Registers Provinces / District w board Tax authorities Water Accounts VEWIN, Assoc of Water companies Tap water statistics - Total drinking water and use by households LEI - FADN FSS Dutch application of Water use and Resource Efficiency indicators
NAMWA : the matrix Dutch application of Water use and Resource Efficiency indicators
Work / projects on Water accounts in NL • 1996: Pilot: first experimental NAMWA • 2002, 2003-2005: Extensions of original NAMWA further extension: addition of more pollutants, more detail for river basins • 2006: Pilot project ‘Dutch Water flow Accounts • 2007-2008: IO-analyses, decomposition analyses • 2009-2010:Water abstraction and –use at 7 River Basins (Baas & Graveland) • 2010-2011: ES/EFTA: NAMEA Task Force on Water Accounts Dutch application of Water use and Resource Efficiency indicators
Work / projects on Water accounts in NL • 2011: Aim to compile full Water balance / water asset accounts for national territory • 2010-2011: TF on RUMEA incl. water. Aim to test CRUMA on Resource Management Activities (& R.Use) • 2011 – 2013(..) CREEA-project: Refine and elaborate economic and environmental accounting incl. water • 2011: Contribute to OECD green growth indicators incl water • Future plans: • Composition of indicators • Doing environmental - Economic Analyses • Perform water footprint / virtual water work • What in regular production? Dutch application of Water use and Resource Efficiency indicators
Use of Dutch water accounts • Publication on environmental accounts • Water framework directive (WS) • Water – Economic modelling • Input-output analyses • Research (scientific and policy) Dutch application of Water use and Resource Efficiency indicators
Main water resource indicators • Total (fresh) water abstraction • Total water use • Water use (and extraction) by industry (NACE) and households • Water use intensity (m3/euro VA) • Intensity of water use by branches of industry • Trend of use over time • River basin data • Production costs of water services • Cost recovery • Total water consumption (requires agreed definition) Dutch application of Water use and Resource Efficiency indicators
Water abstraction by Dutch economy 2008By industry Dutch application of Water use and Resource Efficiency indicators
Industrial water use, GDP growth and employment Source: Environmental Accounts of the Netherlands 2009 (2010) Dutch application of Water use and Resource Efficiency indicators
Tap water use intensity, total tap water and GDP Source: Environmental Accounts of the Netherlands 2009 (2010) Green growth in the Netherlands (2011) Dutch application of Water use and Resource Efficiency indicators
Tap water use by households 1990-2009;population, # households, per capita use Dutch application of Water use and Resource Efficiency indicators
Water use intensities for industries in the Netherlands, 2003, 2006, 2008 Dutch application of Water use and Resource Efficiency indicators
(Tap) Water use intensity per river basin in the Netherlands 2008 • Preliminary result Source: Water abstraction and –use at River Basin Level, 2011. Dutch application of Water use and Resource Efficiency indicators
Abstraction of fresh ground water per River Basin, 2008 Source: Water abstraction and –use at River Basin Level, 2011. Kees Baas and Cor Graveland, EU Water Statistics Grant. Discussion paper (201113) Dutch application of Water use and Resource Efficiency indicators
Other relevant resource indicators ? • Share of groundwater for production tap water by PWS • Water footprints (blue-green-grey) / virtual water • Share of ‘other water’ • RUMEA indicators • Fresh water resources available • Value of water (ecosystem services) • Temporal variation in use and supply • Share of area irrigated vs non-irrigated (rain fed) (by sub sector) • Trend ground water abstraction • Fresh water abstraction per capita (trend) • Percentage leakage in water supply system • Water consumption (requires agreed definition) ? Dutch application of Water use and Resource Efficiency indicators
Thank you for your attention! Questions ?? c.graveland@cbs.nl