Download
1 / 1
10 likes | 99 Views
How Green is your Coffee? Sanita Dhaubanjar ’13, Hannah Hitchhner’12, Sicong Ma’13 Mass and Energy Balance- Picker Engineering Program, Smith College. Life Cycle Inventory.

E N D
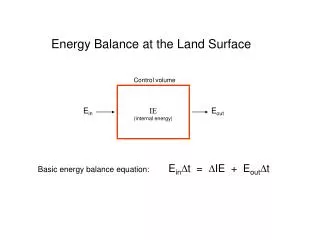
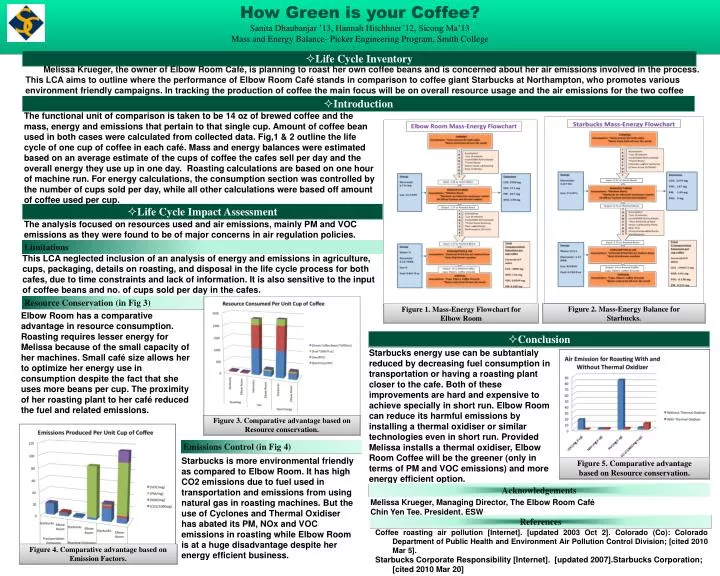
How Green is your Coffee? Sanita Dhaubanjar ’13, Hannah Hitchhner’12, Sicong Ma’13 Mass and Energy Balance- Picker Engineering Program, Smith College • Life Cycle Inventory Melissa Krueger, the owner of Elbow Room Café, is planning to roast her own coffee beans and is concerned about her air emissions involved in the process. This LCA aims to outline where the performance of Elbow Room Café stands in comparison to coffee giant Starbucks at Northampton, who promotes various environment friendly campaigns. In tracking the production of coffee the main focus will be on overall resource usage and the air emissions for the two coffee producers. • Introduction The functional unit of comparison is taken to be 14 oz of brewed coffee and the mass, energy and emissions that pertain to that single cup. Amount of coffee bean used in both cases were calculated from collected data. Fig,1 & 2 outline the life cycle of one cup of coffee in each café. Mass and energy balances were estimated based on an average estimate of the cups of coffee the cafes sell per day and the overall energy they use up in one day. Roasting calculations are based on one hour of machine run. For energy calculations, the consumption section was controlled by the number of cups sold per day, while all other calculations were based off amount of coffee used per cup. • Life Cycle Impact Assessment The analysis focused on resources used and air emissions, mainly PM and VOC emissions as they were found to be of major concerns in air regulation policies. Limitations This LCA neglected inclusion of an analysis of energy and emissions in agriculture, cups, packaging, details on roasting, and disposal in the life cycle process for both cafes, due to time constraints and lack of information. It is also sensitive to the input of coffee beans and no. of cups sold per day in the cafes. Resource Conservation (in Fig 3) Figure 2. Mass-Energy Balance for Starbucks. Elbow Room has a comparative advantage in resource consumption. Roasting requires lesser energy for Melissa because of the small capacity of her machines. Small café size allows her to optimize her energy use in consumption despite the fact that she uses more beans per cup. The proximity of her roasting plant to her café reduced the fuel and related emissions. Figure 1. Mass-Energy Flowchart for Elbow Room • Conclusion Starbucks energy use can be subtantialy reduced by decreasing fuel consumption in transportation or having a roasting plant closer to the cafe. Both of these improvements are hard and expensive to achieve specially in short run. Elbow Room can reduce its harmful emissions by installing a thermal oxidiser or similar technologies even in short run. Provided Melissa installs a thermal oxidiser, Elbow Room Coffee will be the greener (only in terms of PM and VOC emissions) and more energy efficient option. Figure 3. Comparative advantage based on Resource conservation. Figure 4. Comparative advantage based on Emission Factors. Emissions Control (in Fig 4) Starbucks is more environmental friendly as compared to Elbow Room. It has high CO2 emissions due to fuel used in transportation and emissions from using natural gas in roasting machines. But the use of Cyclones and Thermal Oxidiser has abated its PM, NOx and VOC emissions in roasting while Elbow Room is at a huge disadvantage despite her energy efficient business. Acknowledgements Melissa Krueger, Managing Director, The Elbow Room Café Chin Yen Tee, President, ESW References Coffee roasting air pollution [Internet]. [updated 2003 Oct 2]. Colorado (Co): Colorado Department of Public Health and Environment Air Pollution Control Division; [cited 2010 Mar 5]. Starbucks Corporate Responsibility [Internet]. [updated 2007].Starbucks Corporation; [cited 2010 Mar 20] Figure 5. Comparative advantage based on Resource conservation.