Download
1 / 41
420 likes | 508 Views
Air Flow Modeling Study: Central Gallery of the National Museum of the Marine Corps. Analysis by: Galen Burrell Fred Porter Architectural Energy Corporation. Background. Standard HVAC sizing and modeling based on mixed air in space (uniform temperature)

E N D
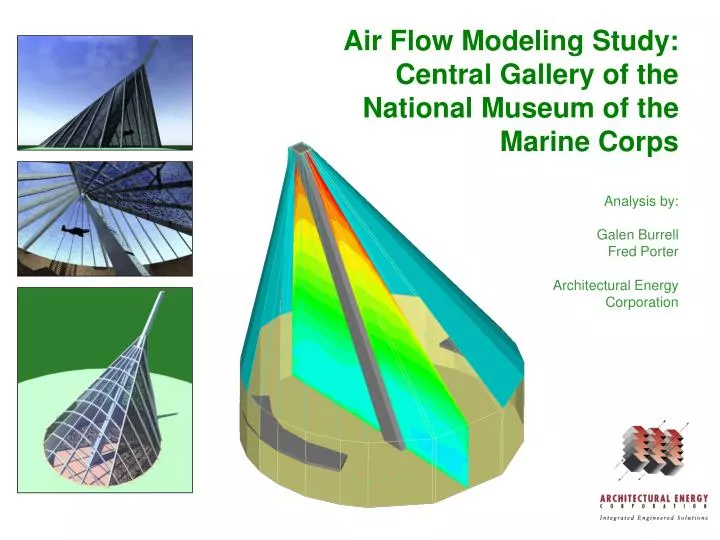
Air Flow Modeling Study: Central Gallery of the National Museum of the Marine Corps Analysis by: Galen Burrell Fred Porter Architectural Energy Corporation
Background • Standard HVAC sizing and modeling based on mixed air in space (uniform temperature) • If space is stratified, these methods overpredict air flow needs • CFD provides more accurate design information (350,000 nodes instead of one!)
Steady-state analysis Solar gains calculated for floor, walls, and glass (accounts for shading by skylight structure) No wind effects on glazing heat transfer No internal flow resistance due to suspended planes and exhibit objects Thermal lag due to mass is assumed to be minimal Walls of adjacent exhibit spaces modeled as adiabatic No airflow assumed through wall openings between Central Gallery and adjacent exhibit spaces Airlock main entry assumed Assumptions & Simplifications
Solar Load Calculation • Radiance model of Central Gallery used to calculate incident solar radiation on interior surfaces, including all influences of skylight structure and framing system • Incident solar radiation values translated into an effective shading coefficient • Effective shading coefficient used in DOE-2 modeling of skylight glazing system to accurately calculate solar heat gain into the Central Gallery • DOE-2 calculates net flux on building surfaces and glazing • Net flux is incorporated into the Airpak model to account for solar heat gain, including the shading effects of the structure July 21, 2:00 PM Dec 21, 12:00 PM
Cooling Load Comparison LOAD TRACE MODEL AIRPAK MODEL Lighting Power Density 3.3 W/ft2 1.5 W/ft2 Occupancy 1,000 persons 500 persons Total Internal Gains 450,000 Btu/hr 250,000 Btu/hr Solar Heat Gain 1,500,000 Btu/hr 1,600,000 Btu/hr Total Sensible Loads 1,950,000 Btu/hr 1,850,000 Btu/hr
Conservative Inputs • No conduction of floor heat load into ground • Floor absorbs 100% of transmitted solar (perfect absorber) • No delay of heat load by thermal mass • Suspended planes do not decrease solar load to occupied zone • Lighting load modeled at floor level
Initial Airpak Model Geometry Exhaust Fan Continuous floor-level return air grilles 10 Upper band supply diffusers (Titus DL) 27 Lower band supply diffusers (Seiho PK).Effective area is equivalent to proposed design of 80 diffusers Second Floor Walkway North
Initial Design Scenarios • Summer • 90,000 CFM Supply, 30,000 CFM Exhaust (suggested by mixed zone analyses) • 60,000 CFM Supply, 30,000 CFM Exhaust • 40,000 CFM Supply, 15,000 CFM Exhaust • All with 90 °F Outside Temperature • Sun position: July 21, 2:00 PM • Winter • 60,000 CFM Supply, No exhaust from top • Night time, 14 °F Outside Temperature • Worst case condensation scenario • 30,000 CFM Supply, No exhaust from top • Cloudy Morning, 30 °F Outside Temperature • 10,000 CFM Supply, No exhaust from top • Cloudy Morning, 30 °F Outside Temperature
Predicted Mean Vote (PMV) +3 +2 +1 0 -1 -2 -3 hotwarmslightlyneutralslightlycoolcold warm cool Based on: • Clothing • Activity level • Air velocity • Temperature • Radiant Temperature • Humidity User input Calculated by Airpak * Does not include radiation from direct sun
Occupied zone average temperature: 67 °F Top zone average temperature: 80 °F Maximum zone temperature: 115 °F Excess cooling capacity exists because air is stratified Predicted Mean Vote Comfort Calculation Accounts for air temperature, humidity, velocity and radiation temperature. Scale ranges from - 3 (too cold) to 3 (too hot) Average PMV in occupied zone: -1.5 Summer: 90k CFM Supply @ 55 °F 30k CFM Exhaust Assumes short sleeve shirt and light trousers Conditions: 2:00 pm / July 21 / Outside Temp = 90 F
Occupied zone average temperature: 71 °F Top zone average temperature: 92 °F Maximum zone temperature: 110 °F Modeled cooling capacity is adequate Predicted Mean Vote Comfort Calculation Average PMV in occupied zone: 0 (comfortable) Summer: 60k CFM Supply @ 55 °F 30k CFM Exhaust Assumes short sleeve shirt and light trousers Conditions: 2:00 pm / July 21 / Outside Temp = 90 F
Does not meet the cooling load adequately Insufficient venting of top space causes extreme temperatures near the glazing Occupied zone average temperature: 80 °F Top zone average temperature: 100 °F Maximum zone temperature: 120 °F Summer: 40k CFM Supply @ 55 °F15k CFM Exhaust Conditions: 2:00 pm / July 21 / Outside Temp = 90 F
90k supply / 30k exhaust Occupied space and above are overcooled Average Predicted Mean Vote in occupied zone is -1.5 (cold) 60k supply / 30k exhaust Maintains comfort in occupied zone Average temperature: 71 °F Air velocities are lower in occupied zones relative to 90k CFM scenario 40k supply / 15k exhaust Does not supply adequate temperatures in occupied zone 120 °F air accumulates in top of skylight Summer Summary
Outside air temperature: 14 °F Banquet conditions 500 People 500 Btu/hr per person Humidity: 0.24 lb/hr per person No recirculation of air from top of skylight Represents worst case condensation scenario Temperature adjacent to glass averages in the high 60 °F range Relative humidity adjacent to glass averages in the mid 60% range No cold pockets exist that would lead to condensation on center of glass panels THERM required for detailed analysis of frame and edge effects Winter: 60k CFM Supply @ 82 °F Temperature Relative Humidity Conditions: Night time / Outside Temp = 14 F
No recirculation of air from top of skylight Little stratification of air temperature Occupied zone average temperature: 72 °F Top zone average temperature : 72 °F Occupied zone average velocity: 100 fpm Winter: 60k CFM Supply @ 82 °F Relative Humidity Temperature • Little stratification of humidity • Average relative humidity: 60% Conditions: Night time / Outside Temp = 14 F
Winter: 60k CFM Supply @ 82 F Airflow distribution from upper and lower diffusers
Occupied zone average temperature: 75 °F Actual supply air volume could be reduced if supply temperature is increased Top zone average temperature: 76 °F Temperature is well-mixed throughout the space Predicted Mean Vote Comfort Calculation Average PMV in occupied zone: 0.4 (slightly warm) Winter: Partly Cloudy Morning30k CFM Supply @ 90 °F Assumes long sleeve shirt and trousers Conditions: Partly Cloudy / Outside Temp = 30 F
Temperature is well-mixed throughout the space Occupied zone average temperature: 68 °F Top zone average temperature: 69 °F Lower airflow with higher temperature achieves comfort conditions and adequate mixing Predicted Mean Vote Comfort Calculation Average PMV in occupied zone: - 0.4 (slightly cool) Winter: Partly Cloudy Morning10k CFM Supply @ 110 °F Assumes long sleeve shirt and trousers Conditions: Partly Cloudy / Outside Temp = 30 F / All air discharged from lower diffusers
60,000 CFM supply @ 82 °F No cold pockets exist that would lead to condensation on center of glass panels THERM analysis will determine edge and frame effects Air temperature is well-mixed throughout the space 30,000 CFM supply @ 90 °F Air temperature is well-mixed throughout the space Average occupied zone temperature: 75 °F 10,000 CFM supply @ 110 °F Comfort conditions are achieved Average occupied zone temperature: 68 °F Winter Summary
Initial Conclusions • Lower cooling supply air flow rate will satisfy the design cooling load • Lower heating supply air flow rate will satisfy the design heating load • Air exhaust from the top of the Central Gallery during the summer is required to control temperatures and radiant heat transfer • In the summer, Central Gallery air temperatures will stratify between 20 and 45 degrees from the top of the “drum” to the top of the skylight, depending on exhaust flow rate • Heating system can provide adequate heat along the skylight glazing to control surface temperatures and condensation potential • Little stratification occurs in the winter heating modes studied in this analysis
Interim Design Direction • Size cooling supply air flow rate at 60,000 CFM • Size exhaust air flow rate at 15,000 CFM • Heating supply air flow rate at 42,000 CFM • Eliminate radiation/convection heating elements at base of skylight glazing • Further analysis is required to determine if central mast is used to exhaust/recirculate air from the top of the skylight to the Central Gallery air-handling unit
Scenarios: Round 2 • Summer, 60,000 CFM • 55 °F supply, 15k CFM top exhaust • 52 °F supply, 15k CFM top exhaust • Winter, 42,000 CFM • Night time • 86 °F supply
Changes from Previous Model • Eliminated upper band supply diffusers • Changed diffuser height to 18’-0” • Added balcony above main entrance to Central Gallery • Eliminated diffusers below the balconies • Added return air through lobby
New Airpak Model Geometry Exhaust Fan Second floor balcony Second floor balcony 38 supply diffusers (Seiho PK).Effective area and throw is equivalent to proposed design Lobby return air (modeled as exhaust fans) Continuous floor-level return air grilles
Full cooling load conditions 92 °F outside Internal loads applied to floor as a constant heat flux Summer Design Conditions Description Sensible Load 500 People Solar Lights 250 Btu/hr/person 1,600,000 Btu/hr 1.5 W/ft2 Total 1,850,000 Btu/hr
Summer: 60k CFM @ 55 °F • Predicted Mean Vote Comfort Calculation • Average PMV in occupied zone: 0.5 (slightly warm) • Occupied zone average temperature: 76 °F • Top zone stratified temperature: 80 to 115 °F • Conservative estimate of internal heat gains at floor level Assumes short sleeve shirt and trousers (0.5 clo)
Summer: 60k CFM @ 55 °F Temperature contour at 6’-0” AFF • Temperature is uniform across the plane (76 °F average) • Higher temperatures near back walls are due to solar flux
Summer: 60k CFM @ 55 °F Air velocity contours at 6’-0” and 18’-0” AFF 18’-0” Plane 6’-0” Plane
Summer: 60k CFM @ 55 °F Vertical velocity contour • Air is relatively still under west balcony due to lack of diffusers • Maximum speed of air in center of gallery approaches 125 fpm
Summer: 60k CFM @ 55 °F • Side velocity plane cut • Induction effects are present near diffusers
Summer: 60k CFM @ 52 °F Temperature contour at 6’-0” AFF • Temperature is uniform across the plane (73 °F average) • Temperatures are approximately 3 °F lower than 55 °F supply case throughout the space
Night time, 14 F outside Banquet conditions Winter Design Conditions Load Sensible Latent 500 people 500 hot meals 30’ steam table 250 Btu/hr/person 38 Btu/hr/meal 36,000 Btu/hr 250 Btu/hr/person 12 Btu/hr/meal 18,000 Btu/hr Total 180,000 Btu/hr 150,000 Btu/hr
Winter: 42k CFM Supply @ 86 °F • Predicted Mean Vote Comfort Calculation • Average PMV in occupied zone: -0.5 (slightly cool) • Occupied zone average temperature: 70 °F • Actual supply air volume or temperature could be reduced • Top zone average temperature: 71 °F • Temperature is well-mixed throughout the space Assumes long sleeve shirt and trousers (0.68 clo)
Winter: 42k CFM Supply @ 86 °F Temperature • Outside air temperature: 14 °F • Banquet conditions • 500 people • 500 hot meals • 30’ steam table • No recirculation of air from top of skylight • Represents worst case condensation scenario • Temperature adjacent to glass Average: 62 °F • Relative humidity adjacent to glassAverage: 40% • THERM required for detailed analysis of frame and edge effects Relative Humidity Conditions: Night time / Outside Temp = 14 °F
Winter: 42k CFM Supply @ 86 °F Velocity vector cut showing downward draft from skylight
Winter: 42k CFM Supply @ 86 °F Velocity contour cut showing downward draft from skylight
Winter: 42k CFM Supply @ 86 °F Temperature cut at 6’-0” AFF showing uniform temperature (70 °F average)
THERM Analysis • Based on 14 °F outside temperature, 60 °F inside (adjacent to glass) • Dew point temperature: 37 °F • Worst case temperature: 42 °F • Condensation will not occur under these conditions Outside (14 °F) Inside (60 °F)
Winter: 42k CFM Supply @ 70 °F (Neutral air case) • Predicted Mean Vote Comfort Calculation • Average PMV in occupied zone: -2.5 (too cold) • Occupied zone average temperature: 65 °F • Actual supply air volume or temperature could be reduced • Top zone average temperature: 63 °F • Temperature is well-mixed throughout the space Assumes long sleeve shirt and trousers (0.68 clo)
Conclusions • CFD analysis shows that the Central Gallery temperatures stratify during summer design conditions • Proposed design (60,000 CFM) maintains comfort during peak summer design conditions in the occupied zone • Mast return/exhaust air (15,000 CFM minimum) is needed to eliminate risk of overheating in the skylight • Air velocities in the occupied zone are acceptable
Conclusions • The proposed design maintains comfort during winter design conditions • At 70% air flow (42,000 CFM) the Central Gallery is well-mixed • Air flow can be modulated using the VSD to maintain comfort under less severe conditions • Condensation will not occur under modeled conditions